Support and resistance levels form the backbone of technical analysis in the forex market. These critical price points provide traders with strategic entry and exit opportunities, helping to identify potential market reversals and breakouts. In this comprehensive guide, we’ll explore how professional traders identify and utilize these powerful concepts to enhance their trading strategies and improve profitability.
What Are Support and Resistance Levels?

In the dynamic world of forex trading, certain price levels tend to repeatedly influence market behavior. These are known as support and resistance levels.
Support levels are price points where downward movement tends to pause or reverse due to increased buying interest. These areas represent zones where buyers typically enter the market in sufficient numbers to overcome selling pressure, preventing further price decline. Think of support as a “floor” beneath the market.
Resistance levels function as the opposite of support. These price zones act as “ceilings,” where upward movements tend to stall or reverse as selling pressure increases. At resistance levels, sellers enter the market in sufficient numbers to overcome buying pressure, preventing further price advancement.
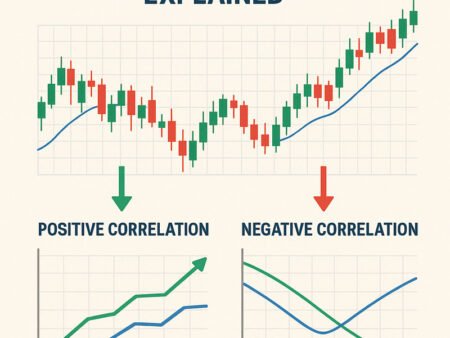
The psychology behind these price barriers is fascinating. Support and resistance levels often develop due to collective market memory and trader psychology:
- At previous lows (support), traders remember price bounced, creating buying interest
- At previous highs (resistance), traders recall price reversed, generating selling interest
- Round numbers (like 1.3000 in EUR/USD) often become psychological barriers
- Previous significant price points can influence future trading decisions
These price levels aren’t formed by coincidence. They develop through the collective actions of market participants reacting to historical price points, leading to behavioral patterns that repeat over time.
Read more: Forex Basics for Beginners – Learn Trading Step by Step
Identifying Support and Resistance Levels
Professional traders employ several methodologies to identify high-probability support and resistance zones:
Historical Price Levels

The most straightforward approach involves identifying price points where the market has reversed multiple times in the past. The more frequently price has reacted at a particular level, the more significant that level becomes. Look for:
- Previous market highs and lows
- Areas where price consolidated for extended periods
- Levels that have prompted significant reversals
Trendlines
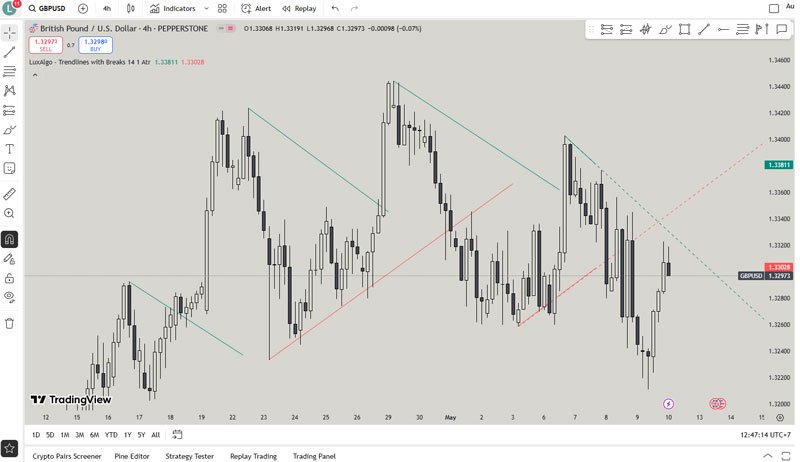
Trendlines connect a series of lows (for uptrends) or highs (for downtrends), creating diagonal support and resistance levels. To draw effective trendlines:
- Identify at least two significant lows or highs
- Connect them with a straight line
- Extend the line into the future to anticipate potential reaction points
Remember that the more touchpoints a trendline has, the more reliable it generally becomes as a support or resistance indicator.
Fibonacci Retracement Levels
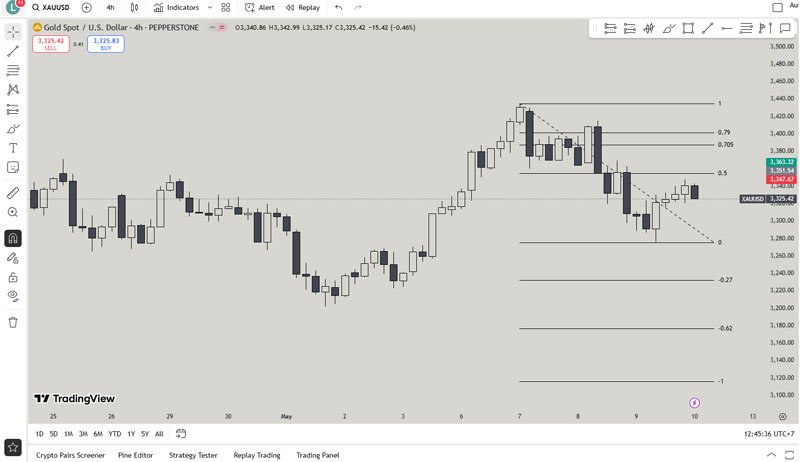
Based on the mathematical Fibonacci sequence, these retracement levels (particularly 38.2%, 50%, and 61.8%) often act as support and resistance. To apply them:
- Identify a significant price move (swing high to swing low or vice versa)
- Apply the Fibonacci retracement tool to this move
- Monitor how price reacts at these calculated levels
Pivot Points
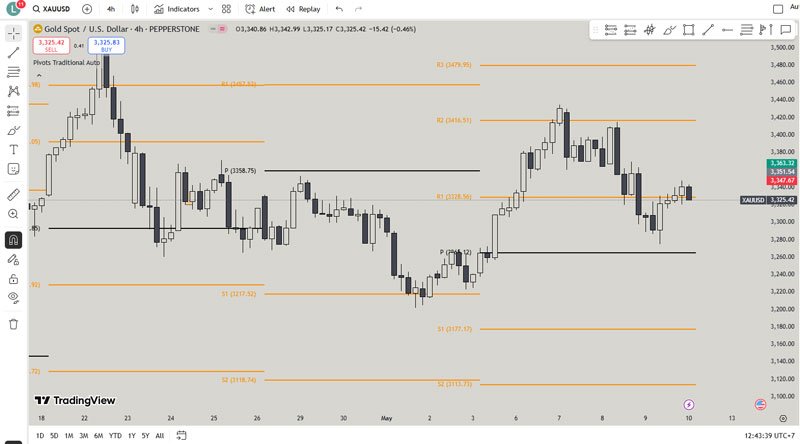
These mathematically derived levels use the previous period’s high, low, and close to calculate potential support and resistance for the current period. Daily pivot points are especially popular among day traders for identifying potential turning points.
Moving Averages
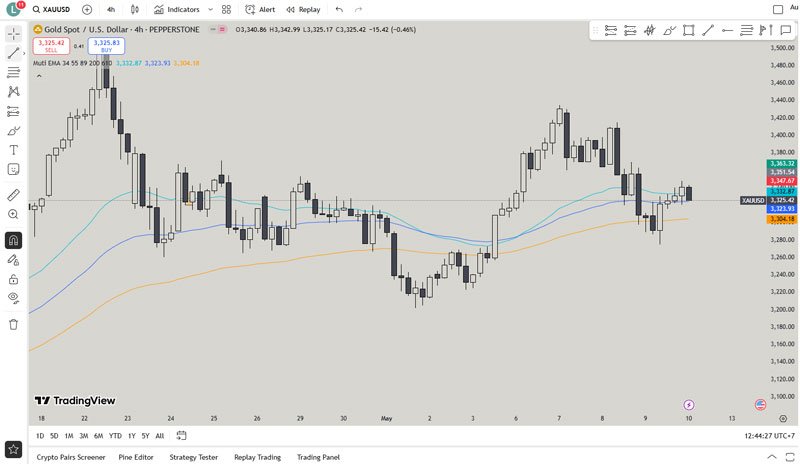
Popular moving averages (50-day, 100-day, 200-day) frequently function as dynamic support and resistance levels. Unlike static levels, these move with price over time, adapting to changing market conditions.
Different Types of Support and Resistance
Understanding the various manifestations of support and resistance allows traders to identify more opportunities:
Horizontal Support and Resistance
These traditional levels run parallel to the x-axis on your chart. They represent price points where the market has historically reversed direction multiple times. Horizontal levels are particularly effective in ranging markets or at major market turning points.
Diagonal Support and Resistance (Trend Lines)
As mentioned earlier, these sloping lines connect a series of higher lows in uptrends or lower highs in downtrends. They provide dynamic levels that change as the trend progresses, helping traders identify when a trend might be losing momentum.
Dynamic Support and Resistance
Moving averages and other indicators create support and resistance levels that adjust automatically as new price data forms. These dynamic levels are particularly useful in trending markets where static levels quickly become outdated.
Psychological Levels
Round numbers (1.2000, 1.2500, etc.) often act as support and resistance due to the psychological importance traders place on them. Large option strikes and derivatives contracts are frequently placed at these levels, adding to their significance.
Confirmation Techniques
Successful traders rarely rely solely on support and resistance levels for trading decisions. Instead, they look for confirmation signals to increase probability:
Volume Analysis
Increased trading volume at key levels adds validity to potential reversals or breakouts:
- High volume on a reversal from support suggests strong buying interest
- High volume on a breakout through resistance indicates strong bullish sentiment
- Low volume on an approach to resistance might signal a weak move likely to fail
Price Action Patterns
Specific candlestick formations near support or resistance provide insights into market sentiment:
- Pin bars (long wicks) at support often indicate rejection of lower prices
- Engulfing patterns at resistance may signal a potential reversal
- Doji candlesticks at key levels suggest indecision and possible reversal
Multiple Timeframe Confirmation
When a support or resistance level aligns across multiple timeframes, its significance increases substantially. For example, if a daily resistance level coincides with a 4-hour resistance level, that zone becomes particularly noteworthy.
Trading Strategies Using Support and Resistance
Let’s explore practical ways to incorporate these concepts into your trading approach:
Bounce Trading Strategy
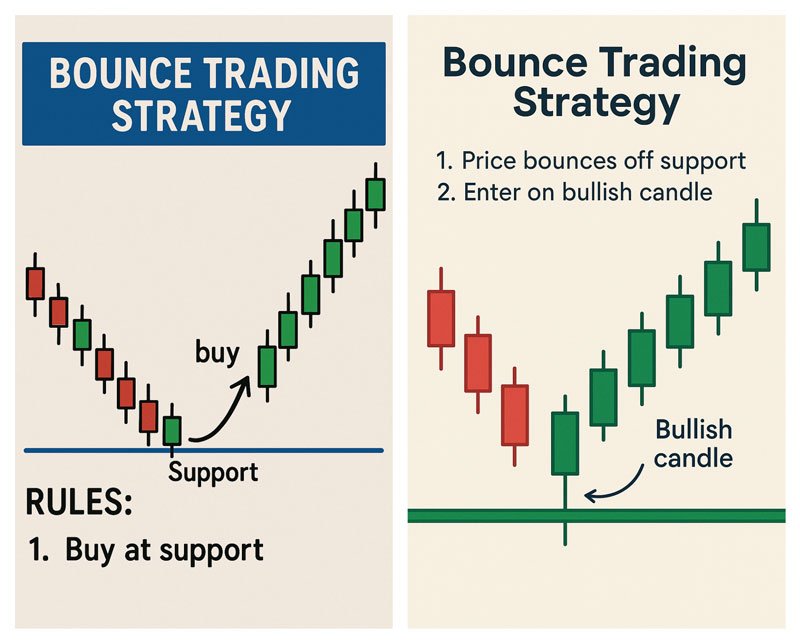
This approach involves entering trades when price reacts at established support or resistance levels:
- For bullish trades:
- Wait for price to approach established support
- Look for confirmation signals (bullish candlestick patterns, divergence, etc.)
- Enter long position slightly above the reversal candle
- Place stop-loss below the support level
- Target previous resistance or set profit using risk-reward ratio
- For bearish trades:
- Wait for price to approach established resistance
- Look for confirmation signals (bearish candlestick patterns, divergence, etc.)
- Enter short position slightly below the reversal candle
- Place stop-loss above the resistance level
- Target previous support or set profit using risk-reward ratio
Breakout Trading Strategy
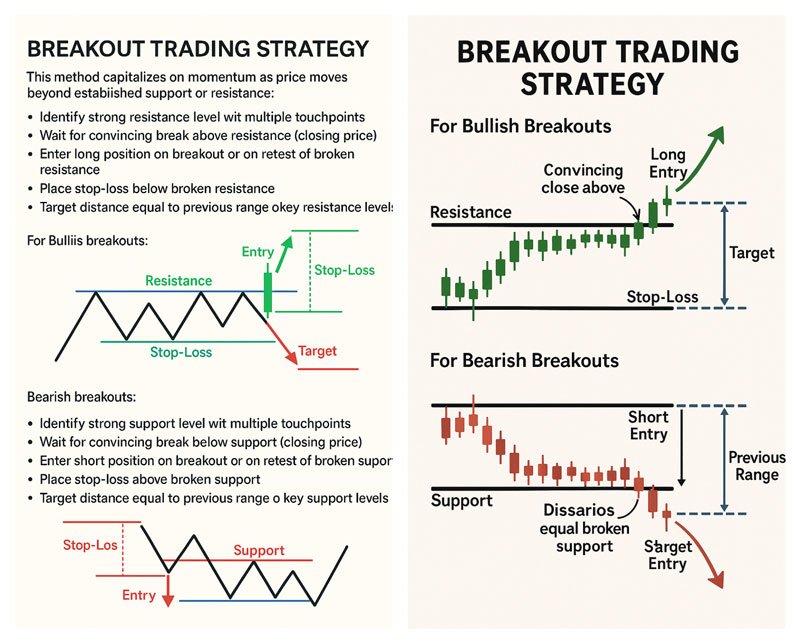
This method capitalizes on momentum as price moves beyond established support or resistance:
- For bullish breakouts:
- Identify strong resistance level with multiple touchpoints
- Wait for convincing break above resistance (closing price)
- Enter long position on breakout or on retest of broken resistance
- Place stop-loss below broken resistance
- Target distance equal to previous range or key resistance levels
- For bearish breakouts:
- Identify strong support level with multiple touchpoints
- Wait for convincing break below support (closing price)
- Enter short position on breakout or on retest of broken support
- Place stop-loss above broken support
- Target distance equal to previous range or key support levels
Avoiding False Breakouts
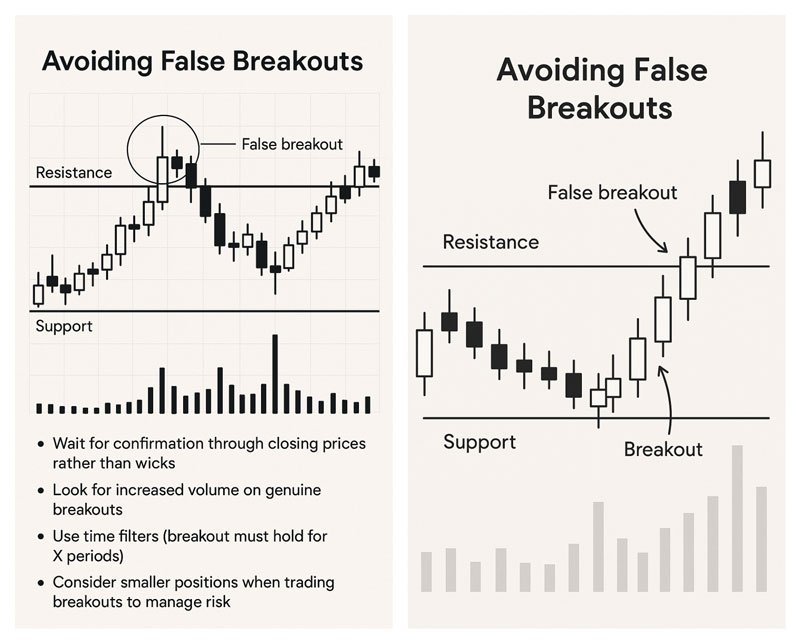
False breakouts (or “fakeouts”) represent one of the biggest challenges when trading support and resistance. To minimize their impact:
- Wait for confirmation through closing prices rather than wicks
- Look for increased volume on genuine breakouts
- Use time filters (breakout must hold for X periods)
- Consider smaller positions when trading breakouts to manage risk
Advanced Support and Resistance Concepts
As you develop your trading expertise, consider these more sophisticated applications:
Role Reversal
One of the most powerful concepts in technical analysis is how support, once broken, often becomes resistance (and vice versa). This phenomenon occurs because traders who missed the initial opportunity often wait for price to return to the broken level before entering positions.
Support and Resistance Zones
Rather than precise price points, professional traders often consider support and resistance as zones spanning a price range. This approach acknowledges market inefficiency and reduces the likelihood of being stopped out by minor price fluctuations.
Market Structure and Order Blocks
Institutional traders often place large orders at key support and resistance levels. These “order blocks” can create areas where price experiences significant reaction due to the absorption or triggering of these large positions. Identifying potential institutional interest points can provide an edge in anticipating major market moves.
Risk Management When Trading Support and Resistance
Even the most accurate support and resistance analysis requires proper risk management:
Strategic Stop Loss Placement
Always place stop losses beyond support or resistance levels, accounting for market volatility. For example:
- For long positions at support: Place stops below support, considering normal market noise
- For short positions at resistance: Place stops above resistance, with adequate buffer
Position Sizing
Never risk more than 1-2% of your trading capital on a single trade, regardless of your confidence level. Adjust position size based on stop loss distance to maintain consistent risk exposure across different setups.
Risk-Reward Ratios
Professional traders typically aim for reward potential at least twice their risk (1:2 or better). Support and resistance levels provide natural targets for calculating these ratios before entering trades.
Common Mistakes and How to Avoid Them
Be aware of these frequent pitfalls when trading support and resistance:
- Overcomplicating Analysis: Using too many indicators can create confusion. Focus on the most significant levels and seek alignment across methods rather than using every technique simultaneously.
- Ignoring Market Context: Support and resistance work differently in trending versus ranging markets. Always consider the broader market environment when applying these concepts.
- Disregarding Timeframes: Levels on higher timeframes generally carry more significance than those on lower timeframes. Align your analysis with your trading timeframe for consistency.
- Failing to Adjust Levels: Support and resistance are not static forever. Markets evolve, and previously significant levels may lose relevance over time. Regularly reassess your levels as new price action develops.
Tools and Indicators for Support and Resistance Trading
While clean price action analysis should form the foundation of your support and resistance trading, these tools can enhance your approach:
- Fibonacci Retracement Tool: Helps identify potential reversal levels during trending markets
- Pivot Point Calculator: Provides mathematically derived support and resistance levels
- Volume Profile: Shows price levels where significant trading activity has occurred
How to Practice Support and Resistance Trading
Developing proficiency in support and resistance trading requires deliberate practice:
- Backtesting: Analyze historical charts to identify how support and resistance have influenced price movement. Mark these levels and observe how price respected them over time.
- Demo Trading: Before risking real capital, practice your support and resistance strategies on a demo account, following your trading plan with discipline.
- Trading Journal: Document every support and resistance trade, including screenshots, rationale, and outcomes. Review regularly to identify patterns in your successful and unsuccessful trades.
Support and resistance trading remains one of the most powerful approaches in the forex market. By understanding the psychology behind these levels, learning to identify them accurately, and implementing proper risk management, traders can develop a substantial edge.
Remember that mastery takes time. Start with the basics, practice consistently, and gradually incorporate the more advanced concepts as your confidence grows. With patience and discipline, support and resistance trading can become a cornerstone of your forex trading success.
Ready to take your trading to the next level? Begin by identifying the three most significant support and resistance levels on your favorite currency pair’s daily chart, then monitor how price reacts at these levels over the coming week. This simple exercise will immediately enhance your market awareness and trading precision.
FAQs About Support and Resistance Trading
What is the difference between support and resistance?
Support represents price levels where downward movement tends to pause or reverse due to increased buying interest, acting as a “floor.” Resistance represents price levels where upward movement tends to stall or reverse as selling pressure increases, acting as a “ceiling.”
How reliable are support and resistance levels?
The reliability of support and resistance increases with the number of times price has respected the level, the timeframe (higher timeframes generally produce more reliable levels), and the amount of trading volume at those levels. No level is 100% reliable, which is why risk management remains essential.
Can support and resistance levels change over time?
Absolutely. Markets evolve continually, and levels that were significant in the past may become less relevant as new price structures form. Regularly updating your analysis is crucial for maintaining effectiveness.
What timeframes work best for support and resistance trading?
Support and resistance concepts work across all timeframes, but higher timeframes (daily, weekly) typically produce more reliable levels. Many professional traders identify key levels on higher timeframes, then use lower timeframes for precise entry and exit execution.
How do I know if a breakout is genuine or false?
Genuine breakouts typically show increased volume, maintain the break beyond the closing of the period, and continue in the breakout direction. False breakouts often display weak volume, quickly reverse, and fail to maintain the new price level. Using confirmation techniques like waiting for a closed candle beyond the level can help distinguish between them.
Should I place orders exactly at support and resistance levels?
Professional traders typically avoid placing orders exactly at obvious levels, as these areas often experience increased volatility. Instead, consider placing orders slightly beyond these levels (for breakouts) or with a small buffer (for reversals) to reduce the likelihood of being caught in false moves.
How many support and resistance levels should I monitor?
Focus on the most significant 3-5 levels to avoid analysis paralysis. Prioritize levels that have been tested multiple times, appear on higher timeframes, or coincide with other technical signals.
Can fundamental factors override support and resistance?
Yes. Major economic news, central bank decisions, or geopolitical events can cause price to break through support or resistance levels that would typically hold under normal market conditions. Always be aware of upcoming high-impact news events when trading based on technical levels.