In the fast-paced world of trading, understanding market dynamics is the key to success. Price action patterns offer traders a direct window into market psychology, enabling them to predict price movements with precision. Unlike indicators that often lag behind, price action relies on raw price data, making it a timeless and versatile tool for traders in forex, stocks, cryptocurrencies, and commodities.
As an expert analyst with years of experience, I’ve seen firsthand how mastering price action can transform trading outcomes. In this comprehensive guide, we’ll explore the most effective price action patterns, how to trade them, and why they’re essential for every trader. Whether you’re a beginner or a seasoned pro, this article will equip you with actionable strategies to elevate your trading game. Let’s dive in!
What Are Price Action Patterns?
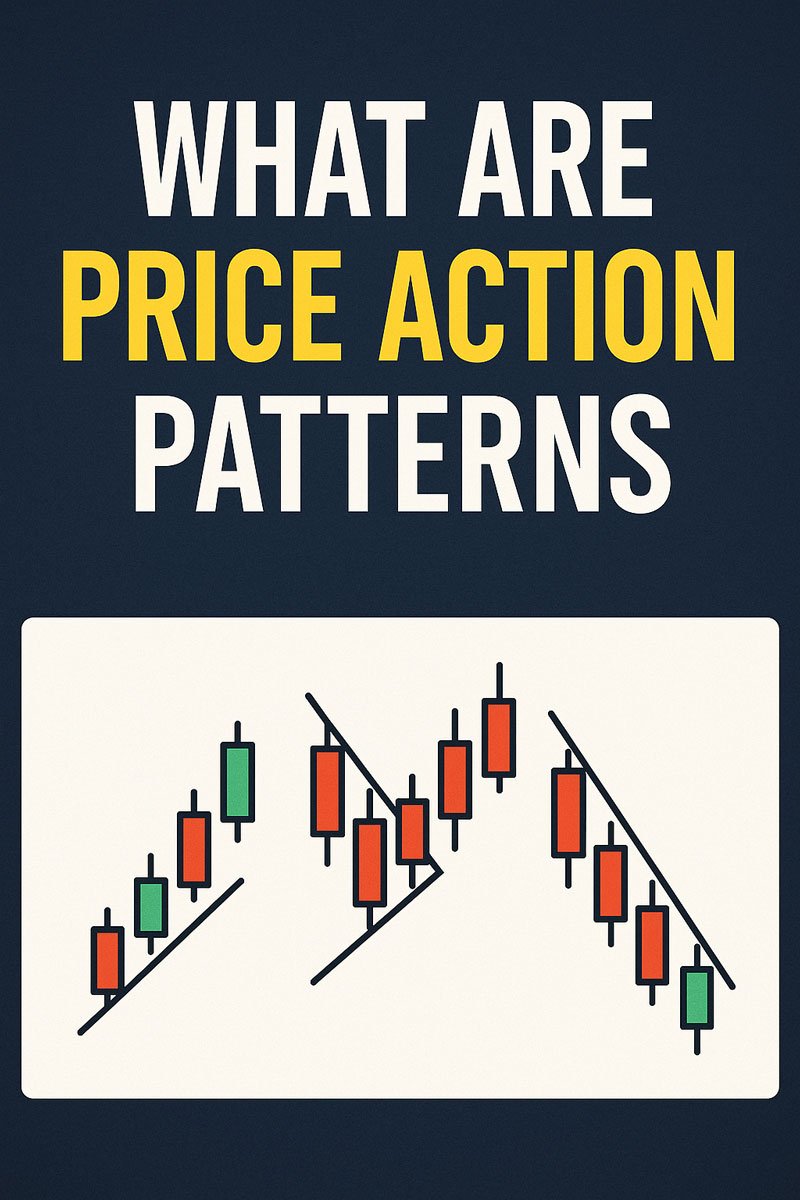
Price action patterns are formations on a price chart that reflect the collective behavior of buyers and sellers. These patterns emerge from the interplay of supply and demand, revealing critical insights into market sentiment. By studying price movements—without relying on complex indicators—traders can identify trends, reversals, and consolidation phases.
Price action is rooted in human psychology, which remains consistent across markets and timeframes. For example, a sudden rejection of a price level often signals strong buying or selling pressure, forming recognizable patterns. To build a strong foundation, explore our Introduction to Technical Analysis.
Why Price Action Patterns Matter
Price action is the backbone of successful trading for several reasons:
- Simplicity: Price action eliminates the clutter of multiple indicators, focusing solely on price behavior.
- Reliability: Patterns are driven by human emotions—greed, fear, hesitation—which are universal and repeatable.
- Versatility: Applicable to day trading, swing trading, or long-term investing across all asset classes.
- Real-Time Insights: Price action reflects current market dynamics, unlike lagging indicators such as moving averages.
By mastering price action, you can make faster, more informed decisions. For a deeper dive into why simplicity wins in trading, check out our Minimalist Trading Strategies.
Top Price Action Patterns Every Trader Should Know
Below, we’ll break down the most powerful price action patterns, their characteristics, and how to trade them effectively. Each pattern is a tool in your trading arsenal, helping you navigate the markets with confidence.
-
Pin Bar
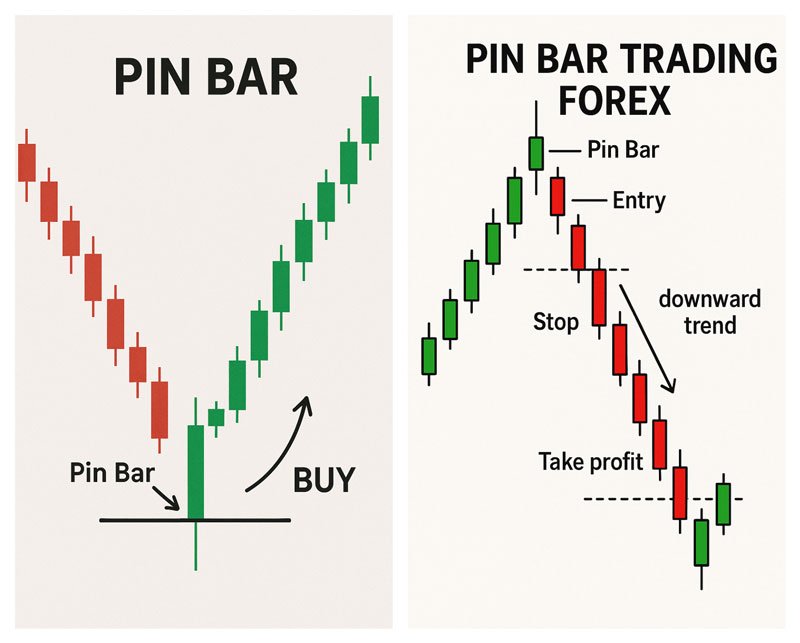
The Pin Bar is a single-candle pattern that signals a strong rejection of a price level. It features a small body and a long tail (shadow), indicating that one side (buyers or sellers) overwhelmed the other. Pin Bars are highly effective at key support or resistance levels.
- Bullish Pin Bar: Forms at a support level, signaling a potential reversal upward. The long lower tail shows buyers stepping in to defend the price.
- Bearish Pin Bar: Appears at a resistance level, hinting at a downward move. The long upper tail indicates selling pressure.
How to Trade: Enter after the Pin Bar closes, with a stop-loss below (for bullish) or above (for bearish) the tail. Confirm the pattern with support and resistance levels or volume spikes. For example, in a forex pair like EUR/USD, a bullish Pin Bar at a daily support level with high volume is a strong buy signal.
Pro Tip: Avoid trading Pin Bars in choppy markets, as they thrive in trending or range-bound conditions.
-
Inside Bar
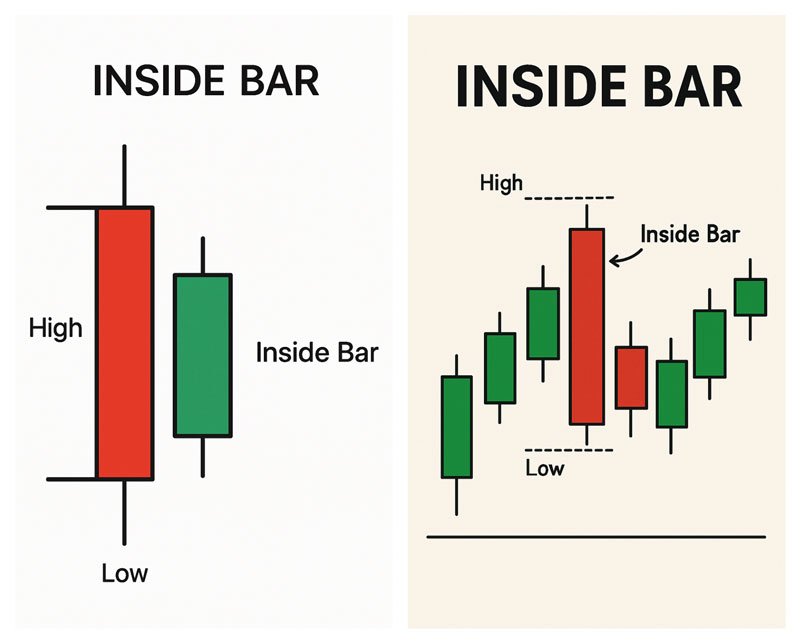
The Inside Bar is a two-candle pattern that represents market indecision. The second candle’s high and low are fully contained within the range of the first candle (the “mother bar”). This pattern often precedes a breakout, making it a favorite among breakout traders.
- Use Case: Trade the breakout of the Inside Bar’s high or low, especially in trending markets.
- Best Timeframe: Higher timeframes (H4 or D1) reduce noise and improve signal clarity.
How to Trade: Place buy and sell stop orders above and below the Inside Bar’s range. Enter when price breaks out, with a stop-loss on the opposite side of the mother bar. For instance, in a stock like Apple (AAPL), an Inside Bar after a strong uptrend could signal a continuation if price breaks higher.
Learn advanced breakout techniques in our Breakout Trading Strategy Guide.
-
Outside Bar (Engulfing)
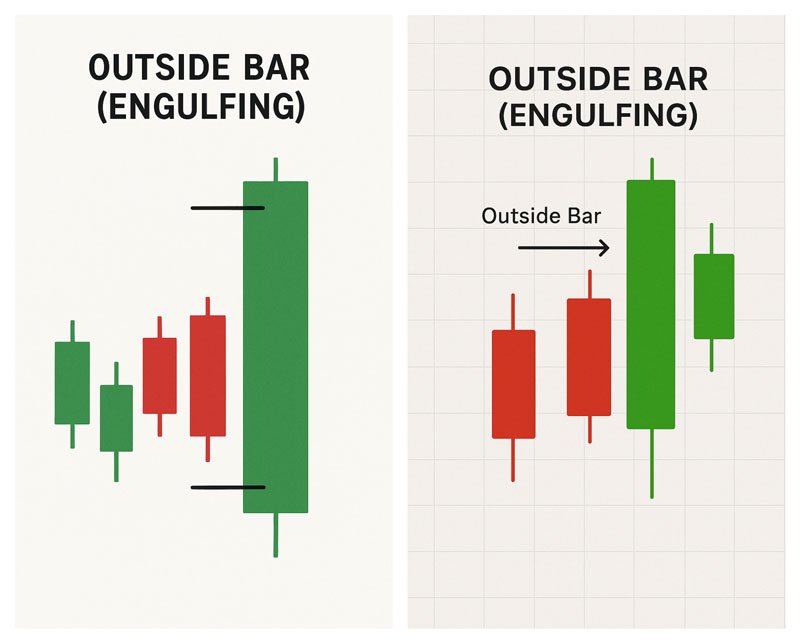
The Outside Bar, or Engulfing pattern, is a powerful reversal signal. It occurs when a candle completely engulfs the previous candle’s range, showing a sudden shift in market sentiment.
- Bullish Engulfing: Forms at the end of a downtrend, signaling a potential rally. The candle’s body engulfs the prior candle, indicating strong buying pressure.
- Bearish Engulfing: Appears at the end of an uptrend, suggesting a decline. Sellers dominate, pushing price lower.
How to Trade: Enter after the Engulfing candle closes, with a stop-loss beyond the pattern’s high/low. For example, in Bitcoin (BTC), a bearish Engulfing at a resistance level like $60,000 could signal a short opportunity.
Key Insight: High-volume Engulfing patterns at key levels are more reliable. Combine with volume analysis for better results.
-
Double Top and Double Bottom
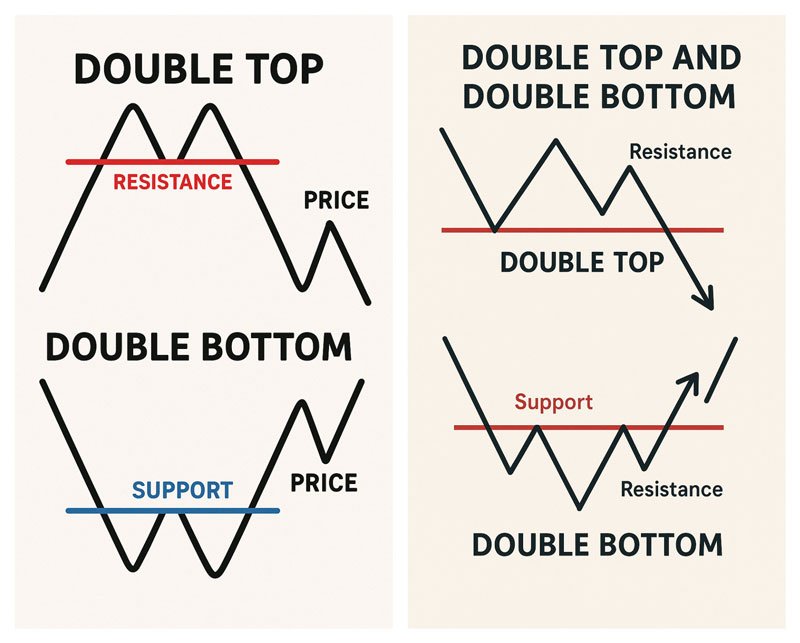
Double Top and Double Bottom patterns signal reversals after price fails to break a key level twice. These patterns are easy to spot and highly effective in trending markets.
- Double Top: A bearish pattern with two peaks at resistance, followed by a breakdown below the “neckline” (support between peaks).
- Double Bottom: A bullish pattern with two troughs at support, followed by a breakout above the neckline.
How to Trade: Enter after the neckline breaks, with a stop-loss above (Double Top) or below (Double Bottom) the pattern. The target is often the height of the pattern projected from the neckline. For example, in gold (XAU/USD), a Double Bottom at $1,800 could target $1,850 if the neckline breaks.
Trading Tip: Confirm with other tools like Fibonacci retracement to avoid false breakouts.
-
Head and Shoulders
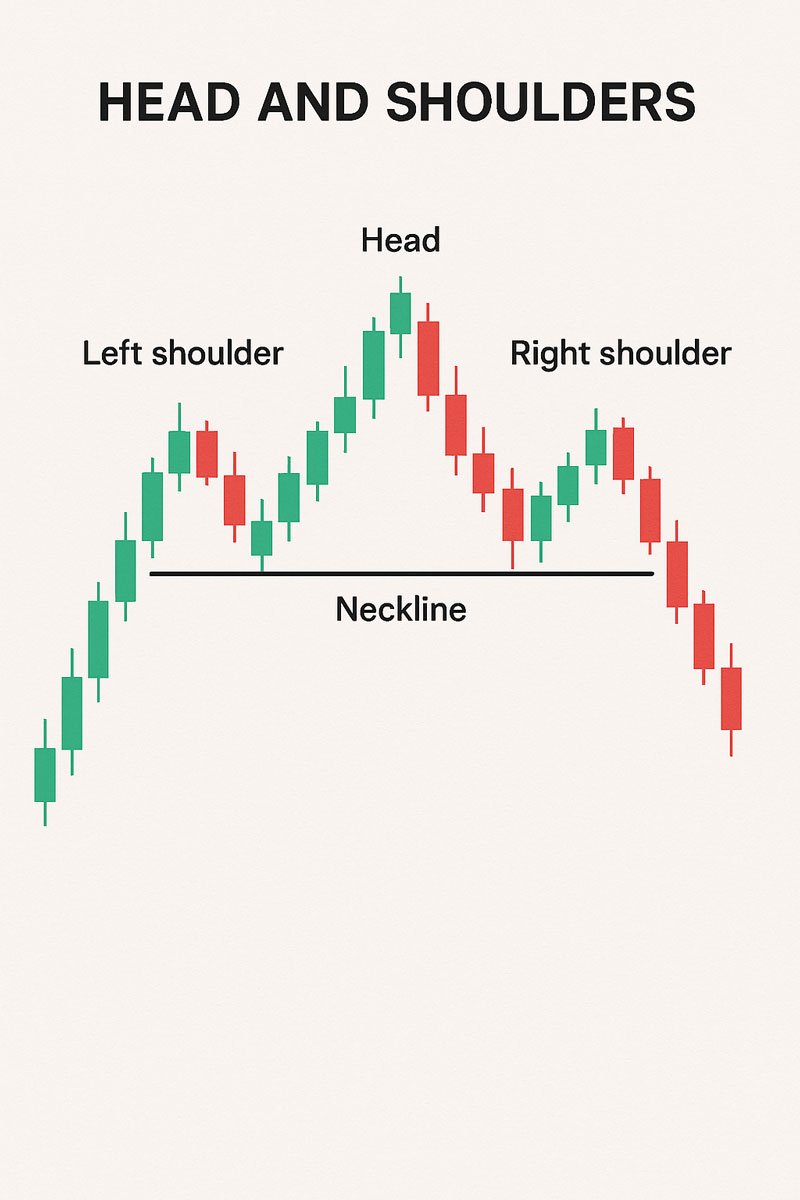
The Head and Shoulders is a classic reversal pattern with three peaks: a higher “head” flanked by two lower “shoulders.” It signals the end of a trend.
- Bearish Head and Shoulders: Forms at the end of an uptrend, with a breakdown below the neckline signaling a reversal.
- Inverse Head and Shoulders: Appears at the end of a downtrend, with a breakout above the neckline indicating a rally.
How to Trade: Enter after the neckline breaks, with a stop-loss above/below the right shoulder. The target is the pattern’s height projected from the neckline. For instance, in the S&P 500, a Head and Shoulders at 5,000 could target 4,800 after a neckline break.
Pro Tip: Look for declining volume on the right shoulder to confirm weakening momentum.
-
Triangles
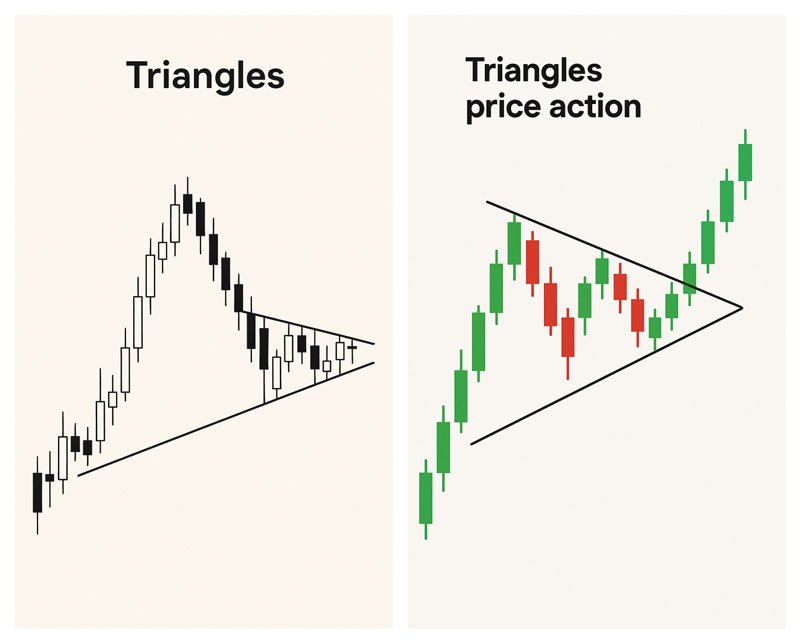
Triangle patterns signal consolidation before a breakout. They come in three forms:
- Ascending Triangle: Bullish, with a flat top (resistance) and rising bottoms (higher lows). Breakout above resistance signals a buy.
- Descending Triangle: Bearish, with a flat bottom (support) and falling tops (lower highs). Breakdown below support signals a sell.
- Symmetrical Triangle: Neutral, with converging trendlines. Breakouts can go either way, depending on the trend.
How to Trade: Enter after the breakout, with a stop-loss inside the triangle. Measure the triangle’s height for a price target. For example, in a crypto pair like ETH/BTC, an Ascending Triangle breakout could signal a strong upmove.
Key Insight: Combine triangles with trendline strategies for precise entries.
-
Fakeout/Breakout Trap
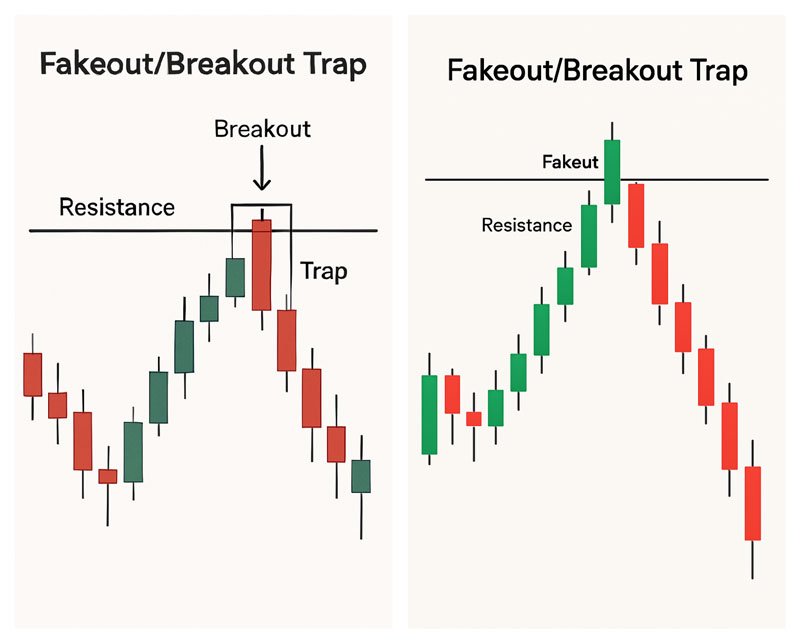
Fakeouts occur when price briefly breaks a key level but reverses, trapping traders. These patterns exploit overeager market participants, creating opportunities for contrarian trades.
- How to Spot: Look for a breakout with low volume or a quick reversal candle (e.g., a Pin Bar).
- How to Trade: Wait for confirmation of the reversal (e.g., a strong candle in the opposite direction) before entering. For example, in forex pair GBP/JPY, a false breakout above resistance followed by a bearish Pin Bar could signal a short.
Pro Tip: Avoid trading breakouts during low-liquidity periods, such as holidays, to reduce fakeout risks.
How to Trade Price Action Patterns Effectively
To succeed with price action patterns, follow these expert strategies:
- Identify Key Levels: Use support, resistance, trendlines, or Fibonacci levels to contextualize patterns. A Pin Bar at a major support level is far more reliable than one in the middle of nowhere.
- Confirm Signals: Combine patterns with volume, candlestick confirmation, or other technical tools. For example, a Head and Shoulders with declining volume on the right shoulder is a stronger signal.
- Choose the Right Timeframe: Higher timeframes (H4, D1) reduce noise and improve accuracy. Day traders can use H1 or M15 but must filter out false signals.
- Manage Risk: Always use a stop-loss and proper position sizing. A 1:2 risk-reward ratio is a good starting point. Explore our Risk Management Guide for advanced techniques.
- Practice Patience: Wait for high-probability setups. Overtrading leads to losses, especially with patterns like Fakeouts.
- Backtest Thoroughly: Use a demo account to test patterns across different markets and timeframes. This builds confidence and refines your strategy.
For a step-by-step trading plan, check out our Complete Trading Blueprint.
Common Mistakes to Avoid
Even experienced traders can fall into traps when trading price action. Here are pitfalls to watch out for:
- Overtrading: Forcing patterns where they don’t exist leads to losses. Stick to clear setups.
- Ignoring Context: A Pin Bar in a strong trend may be a continuation signal, not a reversal. Always consider the broader market trend.
- Neglecting Confirmation: Trading patterns without volume or secondary signals increases risk.
- Poor Risk Management: Failing to use stop-losses or risking too much per trade can wipe out accounts.
- Chasing Breakouts: Fakeouts are common. Wait for confirmation to avoid traps.
Price action patterns are a trader’s secret weapon for navigating the markets with confidence. By mastering patterns like Pin Bars, Inside Bars, Head and Shoulders, and Triangles, you can unlock high-probability setups and make informed decisions. Combine these patterns with disciplined risk management, proper confirmation, and a deep understanding of market context for consistent results.
Ready to take your trading to the next level? Start practicing these patterns on a demo account and explore our Trading Strategies Hub for more expert insights. The markets are waiting—trade smart and succeed!
FAQ: Price Action Patterns
What are price action patterns?
Price action patterns are chart formations that reflect market psychology, used to predict price movements based on historical price data.
Which price action pattern is the most reliable?
No pattern is universally reliable, but Pin Bars and Head and Shoulders are highly effective when confirmed with volume or key levels.
Can I use price action patterns in any market?
Yes, price action works in forex, stocks, crypto, and commodities, as it’s based on universal human behavior.
Do I need indicators to trade price action?
No, price action focuses on raw price data. However, tools like volume or Fibonacci can enhance analysis.
How do I practice trading price action patterns?
Use a demo account to backtest patterns and refine your strategy. Explore our Demo Trading Tips for guidance.
Are price action patterns suitable for beginners?
Yes, beginners can start with simple patterns like Pin Bars on higher timeframes, but practice and patience are key.


