Introduction
The foreign exchange market (forex) is dynamic, fast-paced, and interconnected. Understanding the relationship between currency pairs is one of the most important tools in a trader’s arsenal. This concept, known as forex correlation, can significantly influence your risk management and strategy development.
In this article, we’ll break down everything you need to know about forex correlation — in simple, beginner-friendly terms — while maintaining expert-level depth and real-world examples.
What is Forex Correlation?

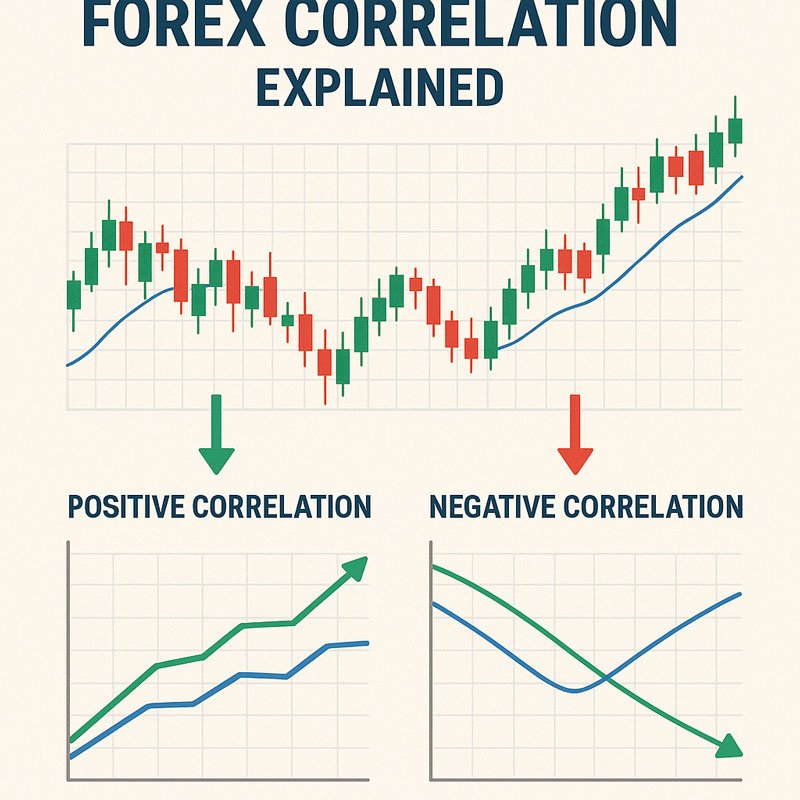
In trading, correlation refers to the relationship between two currency pairs and how they move relative to one another.
- A positive correlation means two pairs tend to move in the same direction.
- A negative correlation means they often move in opposite directions.
🔍 Example:
When EUR/USD and GBP/USD rise or fall together, they are positively correlated. Meanwhile, if EUR/USD rises while USD/CHF drops, they are negatively correlated.
Pay attention: Correlation is not causation — correlation simply indicates price behavior alignment, not that one pair causes the other to move.
How Forex Correlation is Measured
Forex correlation is commonly measured using the correlation coefficient, which ranges from -1.0 to +1.0:
| Coefficient | Meaning |
| +1.0 | Perfect positive correlation |
| 0 | No correlation |
| -1.0 | Perfect negative correlation |
✅ Timeframes Matter
Forex correlations vary depending on the time period analyzed:
- Short-term (Daily): More volatile
- Medium-term (Weekly): Smoother
- Long-term (Monthly): More reliable for strategy building
🛠 Tools to Measure Correlation
- Excel correlation matrix
- Myfxbook Correlation Tool
- MetaTrader indicators
- TradingView scripts
- Common Forex Correlation Examples
Let’s look at some currency pairs that often exhibit strong correlations:
💹 Positive Correlations
- EUR/USD and GBP/USD: Both influenced by the strength/weakness of the U.S. dollar
- AUD/USD and NZD/USD: Both are commodity currencies with similar economic influences
📉 Negative Correlations
- EUR/USD and USD/CHF: When EUR/USD goes up, USD/CHF typically goes down
- GBP/USD and USD/JPY: Often display inverse movement
📊 Sample Correlation Table (12-Month Data)
| Pair A | Pair B | Coefficient |
| EUR/USD | GBP/USD | +0.90 |
| EUR/USD | USD/CHF | -0.89 |
| AUD/USD | NZD/USD | +0.87 |
| USD/JPY | GBP/USD | -0.75 |
Important: These values change over time, so regular monitoring is essential.
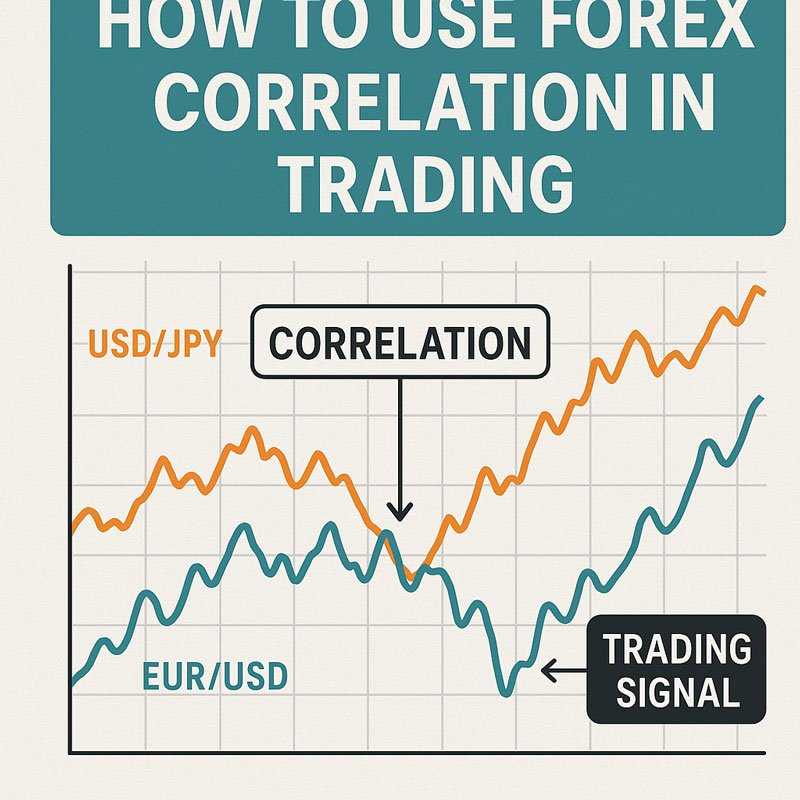
How to Use Forex Correlation in Trading

Avoid Overexposure
If you trade multiple positively correlated pairs, you’re essentially doubling your risk.
Example: Long on EUR/USD and GBP/USD = two trades that may move together. If the USD strengthens, both could go against you.
Hedging with Negative Correlation
Trade one pair long and the negatively correlated pair short. This can help you protect capital during market uncertainty.
Example: Long EUR/USD, Short USD/CHF
Diversify with Low-Correlation Pairs
Look for pairs that don’t correlate strongly. This allows you to spread risk across different economic factors.
Risks and Limitations of Correlation
While correlation is powerful, it is not static.
⚠ Key Risks:
- Correlations shift due to economic policies, interest rate changes, or geopolitical events.
- False sense of security: Overreliance can lead to underestimating real market risk.
- Lag time: Correlation doesn’t guarantee simultaneous movements.
❌ Common Mistakes:
- Assuming correlation = causation
- Overleveraging correlated trades
- Not updating correlation data
Pro tip: Use correlation as a complement, not a replacement, for fundamental and technical analysis.
Tools and Resources to Track Forex Correlation
✅ Recommended Tools:
- Myfxbook Correlation Matrix
- Investing.com Forex Correlation Tool
- TradingView custom scripts
- MT4/MT5 plugins
- Excel manual matrix
🔗 Internal Link Suggestion:
Practical Strategies Using Correlation
Strategy 1: Correlation Confirmation
- Use correlation to confirm a trade. If EUR/USD and GBP/USD both show buy signals, this adds confidence.
- Confirm strength with technical tools like RSI or moving averages.
Strategy 2: Hedge Risk Exposure
- Enter positions on negatively correlated pairs in opposite directions.
- Helps minimize drawdowns in volatile markets.
Strategy 3: Correlation Divergence Trade
- If normally correlated pairs start diverging, it may signal market mispricing or a coming breakout.
- Look for convergence opportunities when they return to typical correlation levels.
Bonus Strategy: Basket Trading Based on Correlation
- Trade a group of highly correlated pairs to capitalize on macroeconomic trends.
- Example: Long AUD/USD, NZD/USD, and CAD/USD when commodity prices are rising.
Case Study:
In March 2020, USD/CHF and EUR/USD broke correlation due to rapid COVID-19 central bank responses. Traders using correlation were alerted to this shift early.
Similarly, in 2022, rising U.S. interest rates disrupted traditional correlations, highlighting the need for continuous monitoring.
Real-World Examples of Forex Correlation in Action
Example 1: Oil Prices and CAD/USD
The Canadian dollar often correlates with crude oil prices. When oil prices rise, CAD strengthens, affecting pairs like USD/CAD.
Example 2: Safe-Haven Flows and JPY/USD
In times of geopolitical tension, investors flee to safe-haven currencies like the Japanese yen (JPY), which can flip correlations based on market fear levels.
Example 3: Economic Reports and Correlation Spikes
Strong U.S. Non-Farm Payroll (NFP) data may cause synchronized movement across multiple USD pairs. Traders should track correlation before and after such events to adjust exposure.
Beginner’s Step-by-Step Guide to Using Forex Correlation
- Start with Major Pairs: Focus on well-known correlations (e.g., EUR/USD & USD/CHF)
- Track Weekly Correlation Data: Use tools to observe 1-week and 1-month changes
- Create a Personal Correlation Matrix: Use Excel or a journal
- Avoid Trading 2+ Positively Correlated Pairs Together
- Use Demo Account to Backtest: Validate strategies before going live
- Combine with Indicators: Support correlation with MACD, RSI, Fibonacci, etc.
- Stay Updated on News: Events can alter correlations drastically
Reminder: Always test strategies on a demo account first before applying real capital.
Conclusion
Understanding forex correlation gives you a strategic edge — especially in risk management, trade confirmation, and portfolio balance. However, correlation is fluid and must be monitored continuously.
Highlight this: Use correlation alongside your other tools — not as a standalone predictor.
The more you observe how currency pairs interact, the better you’ll become at anticipating market behavior. Treat correlation as a living, breathing element of your trading plan.
FAQs About Forex Correlation
What causes forex correlation?
Correlation is often driven by shared economic exposure (like to the U.S. dollar), interest rate policies, or commodity dependence.
Can forex correlation change?
Yes. It evolves with global events, central bank actions, and macroeconomic conditions.
Is correlation enough for trading decisions?
No. It should be combined with technical and fundamental analysis for best results.
Where can I find real-time forex correlation?
Use tools like Myfxbook, Investing.com, or create your own matrix in Excel.
How often should I check forex correlation?
At least weekly, or before entering multiple trades to avoid overexposure.
Do correlations apply to indices or crypto?
Yes, though forex correlation is typically more stable. Crypto and indices can show temporary correlations with currencies during major events.
Can I use correlation for short-term trading like scalping?
Yes, but correlations are less reliable in shorter timeframes due to noise. It’s best combined with technical setups.
What is the best timeframe to analyze correlation?
For swing trading, use weekly/monthly data. For day trading, check 1-hour to 4-hour correlations.


