Have you ever watched currency prices on a chart, wondering why they seem to reverse or stall at certain levels? It’s as if the market is “breathing” – moving in a strong direction, pulling back, and then continuing its original journey. For many traders, this isn’t random. It’s often influenced by a fascinating mathematical tool known as Fibonacci Retracement.
For new entrants to the dynamic world of Forex trading, understanding how to read and anticipate these market movements is paramount. This in-depth guide will demystify Fibonacci Retracement, transforming it from an abstract concept into a practical, powerful weapon in your trading arsenal. We’ll explore its origins, how to apply it accurately, and most importantly, how to integrate it with other proven techniques to enhance your trading decisions and manage risk effectively.
Introduction: Unlocking the Market’s Rhythmic Dance
In the chaotic dance of financial markets, prices rarely move in a straight line. Instead, they exhibit a constant ebb and flow, characterized by impulsive moves in the direction of the trend and corrective pullbacks against it. Understanding these pullbacks is crucial for profitable trading, as they often present ideal opportunities to join an existing trend at a more favorable price.
Enter Fibonacci Retracement, a technical analysis tool that leverages a naturally occurring mathematical sequence to predict these potential price reversals or areas of strong support and resistance. While it might sound complex, its application is surprisingly straightforward, offering a structured approach to identifying high-probability trading setups.
What is Fibonacci Retracement?
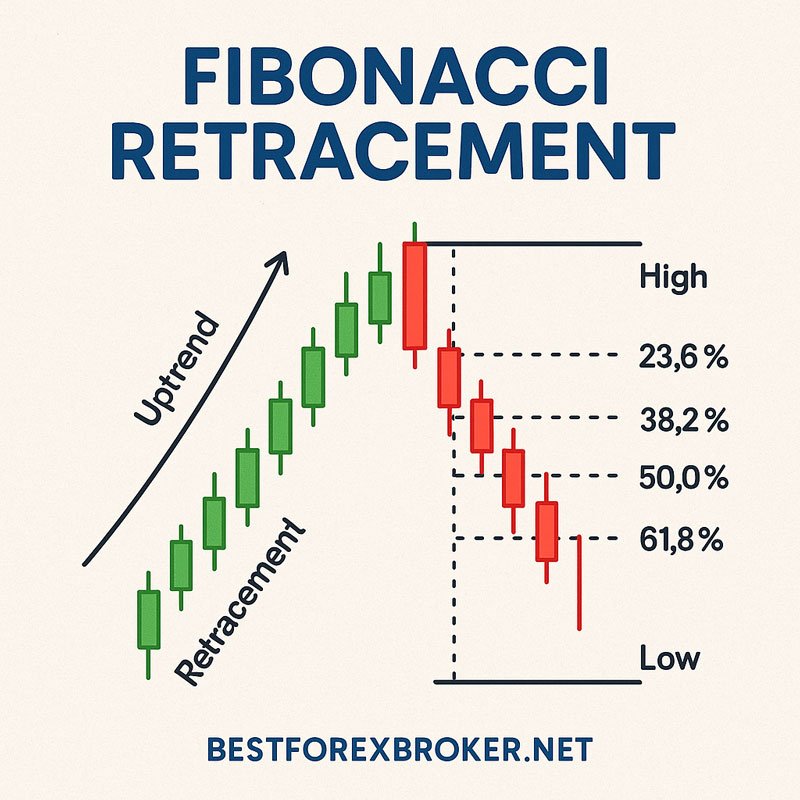
At its core, Fibonacci Retracement is a series of horizontal lines on a price chart that indicate where support and resistance are likely to occur. These levels are derived from the mathematical relationships found in the Fibonacci sequence, a series of numbers discovered by the 13th-century Italian mathematician Leonardo Pisano, known as Fibonacci. The genius of this tool lies in its ability to identify the “sweet spots” where price pullbacks are most likely to end before the original trend resumes.
Why is it important for Forex traders?
For Forex traders, where market efficiency is often high and price action reigns supreme, Fibonacci Retracement offers several key advantages:
- Identifies Potential Entry Points: By highlighting where a pullback might conclude, it helps traders pinpoint optimal levels to enter a trade in the direction of the prevailing trend, often referred to as “buying the dip” in an uptrend or “selling the rally” in a downtrend.
- Assists with Risk Management: These levels can be used to strategically place stop-loss orders, limiting potential losses if the market doesn’t behave as anticipated.
- Helps Set Profit Targets: While primarily a retracement tool, the underlying principles can be extended to project future price targets, aiding in profit-taking strategies.
- Provides a Framework for Understanding Market Psychology: The widespread use of Fibonacci levels by institutions and retail traders alike can create a self-fulfilling prophecy, making these levels even more significant in live market conditions.
This guide will empower you to apply this tool with confidence, recognizing its power while also understanding its limitations and the necessity of combining it with other analytical techniques.
Understanding the Fundamentals: The Golden Threads of the Market
Before we delve into the practical application, it’s essential to grasp the fundamental concepts behind Fibonacci Retracement. It’s not just arbitrary lines; they are rooted in a mathematical sequence that appears throughout nature and art.
The Fibonacci Sequence Explained
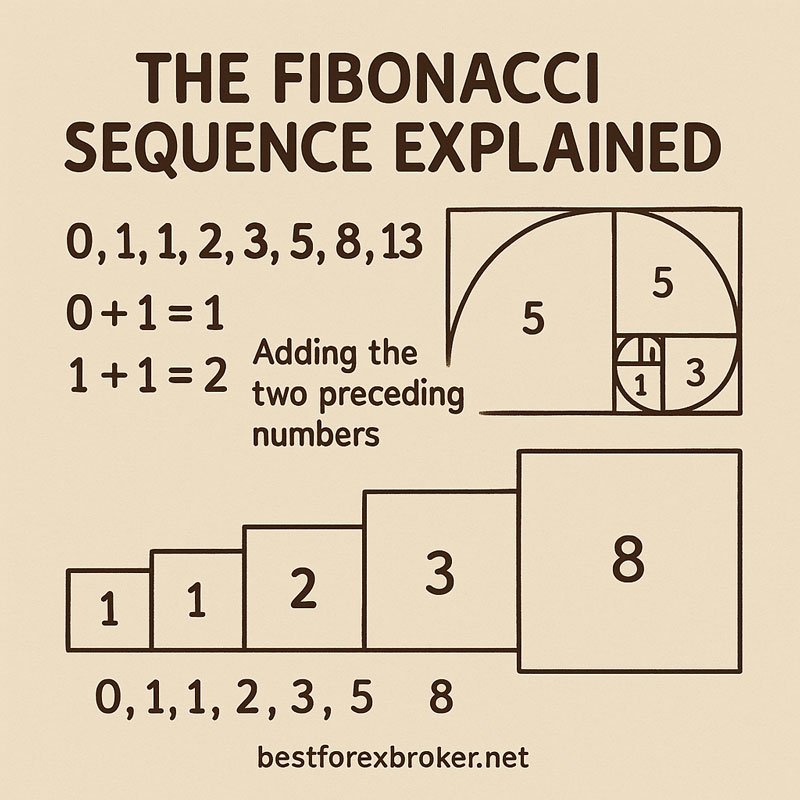
The Fibonacci sequence is a series of numbers where each number is the sum of the two preceding ones. It starts like this:
0, 1, 1, 2, 3, 5, 8, 13, 21, 34, 55, 89, 144, and so on…
(e.g., 0+1=1, 1+1=2, 1+2=3, 2+3=5, 3+5=8, etc.)
While the sequence itself is simple, its profound impact comes from the ratios derived from it.
The Golden Ratio (Phi – phi) and its relationship to Fibonacci
As you progress deeper into the Fibonacci sequence, a remarkable phenomenon occurs: the ratio of any number to its directly preceding number approaches approximately 1.618. This number is famously known as the Golden Ratio, or Phi (phi).
For example:
- 21 / 13 approx 1.615
- 34 / 21 approx 1.619
- 55 / 34 approx 1.617
- 89 / 55 approx 1.618
This Golden Ratio and its inverse (1 / 1.618 approx 0.618) form the bedrock of Fibonacci Retracement. Other key ratios are derived by dividing alternate numbers in the sequence (e.g., 21/55 approx 0.382) or further relationships (e.g., the square root of 0.618 is 0.786, and 1 – 0.236 = 0.764 often used as 76.4% or 78.6%).
Key Fibonacci Retracement Levels
The most commonly used Fibonacci retracement levels, expressed as percentages, are:
- 23.6%: Represents a relatively shallow pullback. Price often shows minor reactions at this level.
- 38.2%: A more significant retracement level. Many traders look for potential reversals here.
- 50%: Although not a direct Fibonacci ratio, the 50% retracement level is widely used and highly respected by traders. It represents a halfway point of the original move and is often a psychological level where price tends to react.
- 61.8%: This is the Golden Ratio itself and is considered one of the most important and watched Fibonacci levels. A reversal at 61.8% suggests a strong continuation of the original trend.
- 78.6%: Represents a deep retracement, close to the original swing low/high, but still indicating a potential reversal before a full reversal of the trend.
These percentages represent the proportion of the previous price move that the price is expected to retrace before potentially continuing in its original direction. For instance, if a currency pair moved up by 100 pips, a 38.2% retracement would mean a pullback of 38.2 pips.
III. How to Draw Fibonacci Retracements on a Chart: A Step-by-Step Guide
Applying Fibonacci Retracement correctly on your trading platform is crucial. Misplacing the start or end points will lead to inaccurate levels and potentially flawed trading decisions.
Identifying a Clear Trend
Fibonacci Retracement tools are most effective when applied in trending markets. They are designed to help you identify potential pullbacks within an existing trend, not to predict the start or end of a trend itself.
- Uptrend: Characterized by a series of higher highs and higher lows.
- Downtrend: Characterized by a series of lower lows and lower highs.
Before drawing Fibonacci levels, ensure you have a clear, discernible trend on your chosen timeframe. Trying to use Fibonacci in a choppy or ranging market will often yield misleading signals.
Identifying Swing Highs and Swing Lows
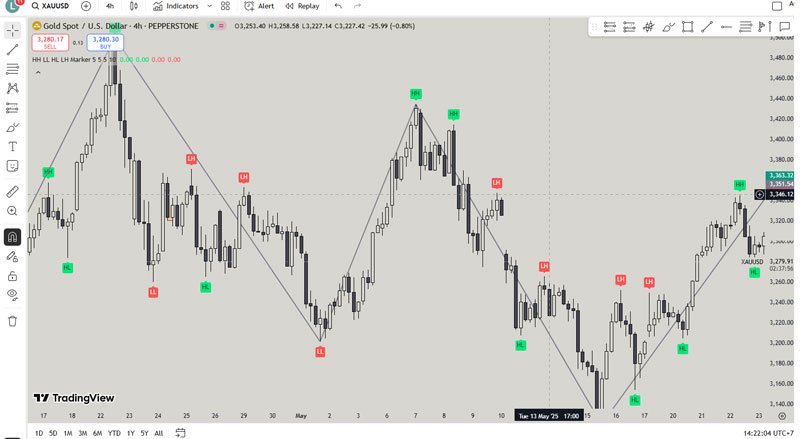
The “swing points” are the anchor points for drawing your Fibonacci levels. These are the significant peaks and troughs in price action.
- Swing High: A candlestick with at least two lower highs on both its left and right sides. It marks a significant peak in price.
- Swing Low: A candlestick with at least two higher lows on both its left and right sides. It marks a significant trough in price.
It’s critical to choose significant swing highs and lows, representing the overall impulsive move you are analyzing. Avoid drawing Fibs on minor fluctuations. The choice of swing points can be somewhat subjective, which is why experience and practice are key to consistent application.
Step-by-Step Guide to Applying the Tool
Most modern charting platforms (like MetaTrader 4/5, TradingView, cTrader) have a built-in Fibonacci Retracement tool.
Select the Fibonacci Retracement Tool: Locate this tool in your charting platform’s drawing tools menu. It usually looks like a “F” or a series of horizontal lines.
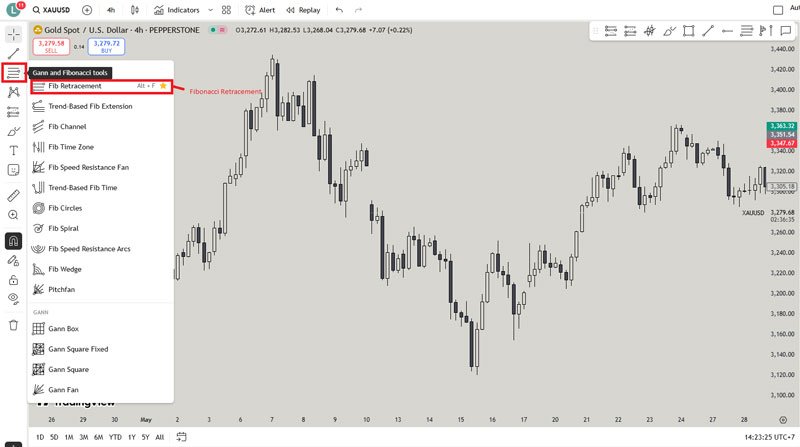
For an Uptrend (Price is Moving Up):
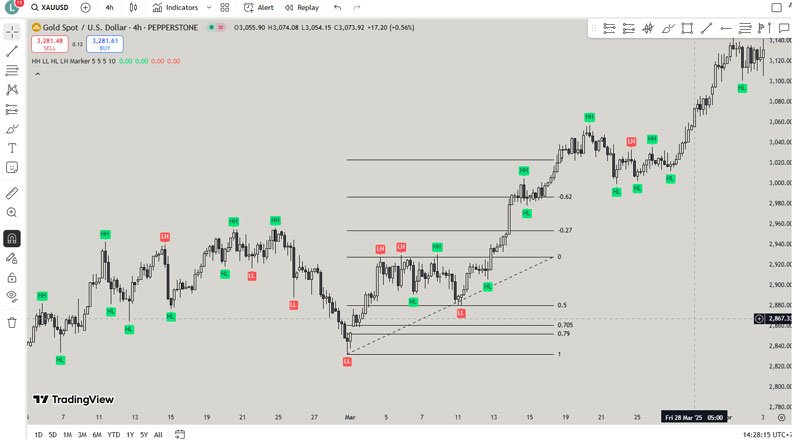
-
- Click and drag from the Swing Low (0% level) to the Swing High (100% level) of the impulse move.
- The platform will then automatically draw horizontal lines at the key Fibonacci retracement percentages (23.6%, 38.2%, 50%, 61.8%, 78.6%) between these two points.
For a Downtrend (Price is Moving Down):
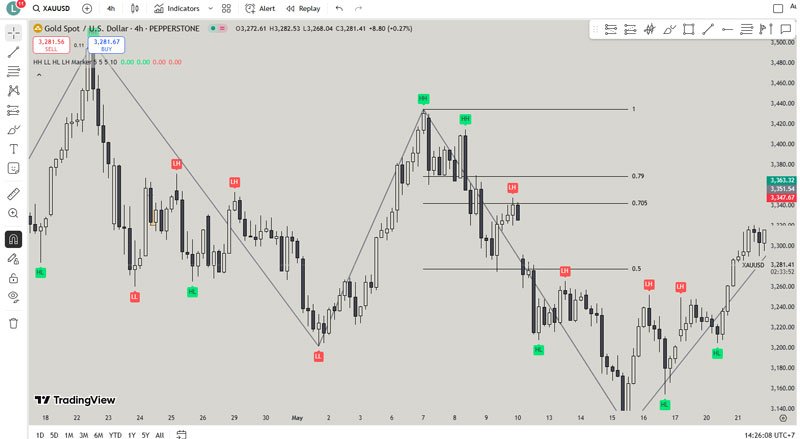
-
- Click and drag from the Swing High (0% level) to the Swing Low (100% level) of the impulse move.
- Again, the platform will automatically plot the retracement levels.
Visualizing the horizontal lines on the chart: Once drawn, these lines extend horizontally across your chart, acting as potential levels where price might find support (in an uptrend) or resistance (in a downtrend) during a pullback.
Interpreting Fibonacci Retracement Levels: Reading the Market’s Map
Drawing the lines is only the first step. The true power of Fibonacci Retracement lies in your ability to interpret price action at these levels.
Understanding Support and Resistance
The core concept of Fibonacci Retracement is that these levels act as dynamic areas of support and resistance.
- In an Uptrend: When price pulls back, Fibonacci levels like 38.2%, 50%, and 61.8% are expected to act as support levels. This means buyers are likely to step in at these levels, pushing the price back up to continue the original uptrend.
- In a Downtrend: When price rallies during a pullback, Fibonacci levels like 38.2%, 50%, and 61.8% are expected to act as resistance levels. This means sellers are likely to enter the market at these levels, pushing the price back down to continue the original downtrend.
The Significance of Each Level
While all Fibonacci levels are important, some carry more weight based on market psychology and historical observation:
- 38.2% and 61.8% are often considered the most significant retracement levels. Many traders view a retracement to 38.2% as a relatively strong trend, while a deeper retracement to 61.8% (the Golden Ratio) suggests a healthy correction that still honors the original trend direction.
- The 50% level, while not a pure Fibonacci ratio, is incredibly popular. It represents the exact halfway point of the move, and its psychological significance often leads to strong price reactions. Price often tests the 50% level before continuing.
- The 23.6% level indicates a very shallow pullback in a particularly strong trend.
- The 78.6% level suggests a very deep retracement, often indicating that the original trend may be weakening, but still has a chance to resume. A break below this level (in an uptrend) or above it (in a downtrend) might signal a potential trend reversal.
What to Look For at These Levels
Simply seeing a Fibonacci line on your chart isn’t enough to execute a trade. You need confirmation that the level is holding. Look for:
- Price stalling or pausing: The price action slows down, consolidates, or oscillates around the Fibonacci level.
- Candlestick Reversal Patterns: Look for specific candlestick patterns that signal a reversal. For example, in an uptrend pullback to a Fib level, look for bullish engulfing patterns, hammers, morning stars, or piercing patterns. In a downtrend pullback, look for bearish engulfing patterns, shooting stars, evening stars, or dark cloud cover. (Learn more about Candlestick Patterns to enhance your analysis).
- Increased Volume: A surge in trading volume as price reaches a Fibonacci level, especially when combined with a reversal candlestick, can confirm strong buying (at support) or selling (at resistance) interest.
Trading Strategies Using Fibonacci Retracement: Building Confluence
Fibonacci Retracement is a powerful tool, but like any indicator, it is most effective when combined with other forms of technical analysis. This concept is known as confluence – when multiple independent signals align at the same price point, strengthening the probability of a successful trade.
Combining with Other Technical Indicators (Confluence)
Here’s how to build robust trading strategies by combining Fibonacci with other popular indicators:
- Moving Averages (MAs):
- Strategy: Look for a key Fibonacci retracement level that coincides with a significant moving average (e.g., 50-period, 100-period, or 200-period Simple or Exponential Moving Average).
- Example: In an uptrend, if price pulls back to the 61.8% Fibonacci level, and that level also aligns with a rising 50-period moving average, it presents a very strong support zone. (Explore our guide on Moving Averages for Trend Identification).
- Trendlines:
- Strategy: When a Fibonacci retracement level aligns perfectly with a well-established trendline, it reinforces the strength of that level as a potential turning point.
- Example: In a downtrend, if price rallies back to the 38.2% Fibonacci level, and this level also touches a declining trendline, it signals a strong resistance point for sellers to enter.
- Oscillators (RSI, MACD, Stochastic):
- Strategy: Use oscillators to confirm overbought/oversold conditions or divergence at Fibonacci levels.
- Example: If price reaches a 61.8% Fibonacci support in an uptrend, and simultaneously the Relative Strength Index (RSI) is showing an oversold condition (below 30) or bullish divergence (price making lower lows, but RSI making higher lows), it provides strong confirmation of a potential bounce.
- Candlestick Patterns:
- Strategy: As mentioned earlier, the formation of clear reversal candlestick patterns at a Fibonacci level significantly strengthens the trade setup.
- Example: After an uptrend, price pulls back to the 50% retracement. A large bullish engulfing candlestick forms right on this level. This indicates that buyers have strongly rejected further downward movement, signaling a high-probability long entry. (Deep dive into Advanced Candlestick Trading for more reversal signals).
Entry Point Strategies
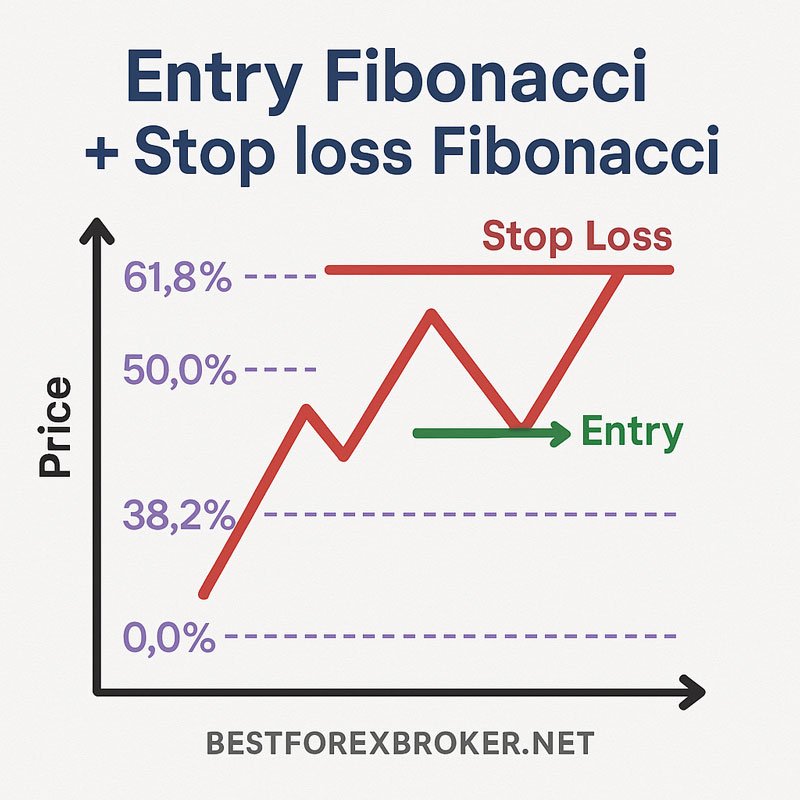
The primary goal of Fibonacci Retracement is to identify optimal entry points during a pullback.
- Conservative Entry: Wait for price to retrace to a key Fib level (e.g., 38.2%, 50%, or 61.8%) and show a clear confirmation signal, such as a strong reversal candlestick pattern, a bounce off a moving average, or a clear rejection of the level. This minimizes false signals.
- Aggressive Entry: Some experienced traders might enter as soon as price touches a significant Fibonacci level, especially in strong trends, but this carries higher risk as confirmation isn’t waited for.
- “Buy the Dip” (Uptrends): Identify an uptrend, draw Fibonacci from swing low to swing high. When price retraces to a support level (e.g., 50% or 61.8%), look for bullish confirmation to enter a long (buy) position.
- “Sell the Rally” (Downtrends): Identify a downtrend, draw Fibonacci from swing high to swing low. When price rallies back to a resistance level (e.g., 50% or 61.8%), look for bearish confirmation to enter a short (sell) position.
Stop-Loss Placement
Effective risk management is paramount in Forex trading. Fibonacci levels provide logical places to set your stop-loss orders.
- Beyond the Next Fib Level: A common strategy is to place your stop-loss just beyond the next significant Fibonacci level. For example, if you enter a long trade at the 50% retracement, place your stop-loss below the 61.8% level. This gives the trade some room to breathe while keeping your risk defined.
- Below the Initial Swing Low/Above the Initial Swing High: For a more conservative stop-loss, you can place it below the initial swing low (in an uptrend) or above the initial swing high (in a downtrend) used to draw your Fibonacci. This offers maximum protection but results in a larger stop-loss and thus, a smaller position size for the same risk.
Profit Target Strategies (Briefly mention Extensions)
While Fibonacci Retracements help identify entry points, Fibonacci Extensions are used to project profit targets beyond the original move. This is a slightly more advanced concept, but it’s important to be aware of.
- Fibonacci Extensions (e.g., 127.2%, 161.8%, 200%, 261.8%): These levels are drawn by anchoring the Fibonacci tool to three points: the start of the impulse move, the end of the impulse move, and the end of the retracement. The extension levels then project where the price might go if the trend continues strongly.
- Targeting Previous Swing Highs/Lows: A simpler approach for beginners is to target the previous swing high (in an uptrend) or swing low (in a downtrend) as an initial profit target.
Tips for Effective Use of Fibonacci Retracement: Mastering the Art
To truly master Fibonacci Retracement, consider these best practices:
Not a Standalone Tool: Always Use in Conjunction with Other Analysis
This cannot be stressed enough. Fibonacci Retracement should always be used as a confirmatory tool, not as a sole decision-making indicator. Its power is amplified when combined with other forms of technical analysis like trendlines, moving averages, candlestick patterns, and market structure. Relying solely on Fib levels is a common mistake for new traders.
Practice and Backtesting: The Path to Proficiency
The subjective nature of identifying swing points means that practice is paramount.
- Backtesting: Spend time on historical charts, identifying trends, drawing Fibonacci levels, and observing how price reacted. Did it respect the levels? What confirmations were present? This hands-on experience will build your confidence and refine your eye for identifying the right swing points.
- Demo Trading: Practice your strategies on a demo account before risking real capital. This allows you to test your understanding in a live market environment without financial risk.
Choosing the Right Timeframe
Fibonacci Retracement can be applied to any timeframe, from minute charts to weekly or monthly charts.
- Higher Timeframes (Daily, Weekly): Generally, Fibonacci levels tend to be more reliable and significant on higher timeframes. This is because larger timeframes filter out a lot of the market noise and often reflect broader market sentiment. Significant levels on a daily chart will likely have a stronger impact than those on a 5-minute chart.
- Multiple Timeframe Analysis: Consider using Fibonacci on a higher timeframe to identify major support/resistance zones, and then zoom into a lower timeframe to look for entry confirmations within those zones. (Understand more about Multiple Timeframe Analysis for comprehensive insights).
Adaptability to Different Markets (Forex, Stocks, Crypto, Commodities)

The beauty of Fibonacci Retracement is its universality. The underlying mathematical principles apply across various financial markets, including:
- Forex: Extremely popular due to the inherent trending nature of currency pairs.
- Stocks: Used to identify potential buy/sell zones for equity pullbacks.
- Cryptocurrency: Effective in the often volatile crypto markets, especially during trending periods.
- Commodities: Applicable to metals, oil, and other commodities.
Risk Management: The Unbreakable Rule
Regardless of how confident you are in a Fibonacci setup, always practice stringent risk management.
- Define Your Risk per Trade: Never risk more than a small percentage (e.g., 1-2%) of your trading capital on any single trade.
- Set Stop-Loss Orders: Always use stop-loss orders to limit potential losses if the trade goes against you. Fibonacci levels provide excellent natural places for these.
- Don’t Over-leverage: Especially in Forex, leverage can amplify both gains and losses. Use it responsibly.
VII. Common Mistakes and Limitations: What to Watch Out For
While powerful, Fibonacci Retracement is not a magical crystal ball. Being aware of its limitations and common pitfalls is crucial for responsible trading.
Subjectivity in Choosing Swing Points
This is perhaps the biggest challenge. What one trader identifies as a “significant” swing high or low, another might see as a minor fluctuation. This subjectivity can lead to different traders drawing different Fibonacci levels on the same chart, resulting in conflicting signals.
- Mitigation: Gain experience through practice, stick to clear and obvious swing points, and seek confluence with other indicators to validate your chosen levels.
Not Always Accurate: Price Doesn’t Always Respect the Levels
Fibonacci levels are potential areas of support and resistance, not guaranteed turning points. Price can, and often will, blow right through these levels, especially during high-impact news events or strong market momentum.
- Mitigation: Never trade solely based on a Fibonacci level. Always wait for price action confirmation (e.g., reversal candlesticks, rejection) before entering a trade.
Works Best in Trending Markets: Less Effective in Choppy or Ranging Markets
As emphasized, Fibonacci Retracement is designed for trends. In sideways or ranging markets, price bounces erratically and often disrespects Fibonacci levels.
- Mitigation: Identify the market environment first. If the market is clearly ranging, avoid using Fibonacci Retracement as a primary tool. Focus on identifying consolidation patterns and breakouts instead.
Self-Fulfilling Prophecy Argument
Some critics argue that Fibonacci levels “work” primarily because so many traders use them. This means that enough market participants place their buy/sell orders around these levels, which in turn causes the price to react. While this doesn’t diminish their practical utility, it’s a point to consider in understanding market dynamics.
VIII. Conclusion: Integrating Fibonacci for Enhanced Trading Decisions
Fibonacci Retracement, rooted in ancient mathematical principles, offers Forex traders a remarkably powerful and intuitive tool for understanding market dynamics. By providing potential turning points during price pullbacks, it empowers you to identify strategic entry and exit opportunities, enhance your risk management, and ultimately, make more informed trading decisions.
However, its true strength lies not in its standalone predictive power, but in its ability to build confluence with other technical analysis methods. By combining Fibonacci levels with trendlines, moving averages, candlestick patterns, and volume analysis, you create a robust framework that significantly increases the probability of successful trades.
Remember, the journey to becoming a proficient Forex trader is continuous. Practice is paramount. Spend time on your charts, backtest your strategies, and meticulously analyze past price action. Understand that no single tool is infallible, and the market is constantly evolving.
Embrace Fibonacci Retracement not as a magic bullet, but as a sophisticated lens through which to observe and interpret the market’s rhythmic dance. By integrating it thoughtfully into your trading plan and consistently applying sound risk management principles, you will be well on your way to navigating the Forex market with greater confidence and precision.
Frequently Asked Questions (FAQs) about Fibonacci Retracement
What is the primary purpose of Fibonacci Retracement in trading?
The primary purpose of Fibonacci Retracement is to identify potential support and resistance levels where a price pullback (retracement) within an existing trend might end, allowing traders to find opportune entry points to join the ongoing trend.
Are Fibonacci Retracement levels guaranteed reversal points?
No, Fibonacci Retracement levels are not guaranteed reversal points. They are areas of potential support or resistance. Price might react to them, break through them, or consolidate around them. Always wait for additional price action confirmation (e.g., reversal candlesticks, bounce) before making trading decisions.
Which Fibonacci levels are considered the most important?
While all levels are relevant, the 38.2%, 50%, and 61.8% retracement levels are generally considered the most significant and are watched closely by the majority of traders due to historical price reactions.
How do I correctly draw Fibonacci Retracement in an uptrend?
In an uptrend, you draw the Fibonacci tool from the swing low (0%) to the swing high (100%) of the impulsive price move. The retracement levels will then appear horizontally between these two points.
Can I use Fibonacci Retracement on any timeframe?
Yes, Fibonacci Retracement can be applied to any timeframe. However, the levels tend to be more reliable and significant on higher timeframes (e.g., daily, weekly charts) as they represent larger market movements.
What is “confluence” in the context of Fibonacci trading?
Confluence refers to the situation where a Fibonacci retracement level aligns with other technical indicators or chart elements, such as a moving average, a trendline, or a previous support/resistance zone. When multiple indicators confirm a level, it increases its significance and the probability of a successful trade.
How do I set stop-loss orders using Fibonacci Retracement?
A common method is to place your stop-loss order just beyond the next significant Fibonacci level in the direction opposite to your trade. For example, if you buy at the 50% retracement, place your stop-loss below the 61.8% level.
Is Fibonacci Retracement suitable for beginners in Forex?
Yes, Fibonacci Retracement is a popular and valuable tool for beginners, but it requires practice and understanding of its limitations. It should always be used in conjunction with other basic technical analysis concepts like identifying trends, support/resistance, and candlestick patterns.
