Japanese candlestick analysis represents one of the most powerful and visually intuitive methods for understanding market movements in forex trading. Originally developed by Japanese rice traders in the 18th century, these time-tested patterns continue to provide invaluable insights into market psychology and price action for modern traders worldwide.
Whether you’re completely new to forex trading or looking to enhance your technical analysis skills, mastering Japanese candlestick patterns will give you a significant advantage in reading market sentiment and making informed trading decisions. This comprehensive guide will walk you through everything you need to know about candlestick analysis, from basic forex formations to advanced trading strategies.
Understanding the Anatomy of Japanese Candlestick Charts
Before diving into specific patterns, it’s crucial to understand what each Japanese candlestick represents. Unlike traditional bar charts, candlesticks provide a clear visual representation of four key price points within a specific time period.
The Four Essential Components
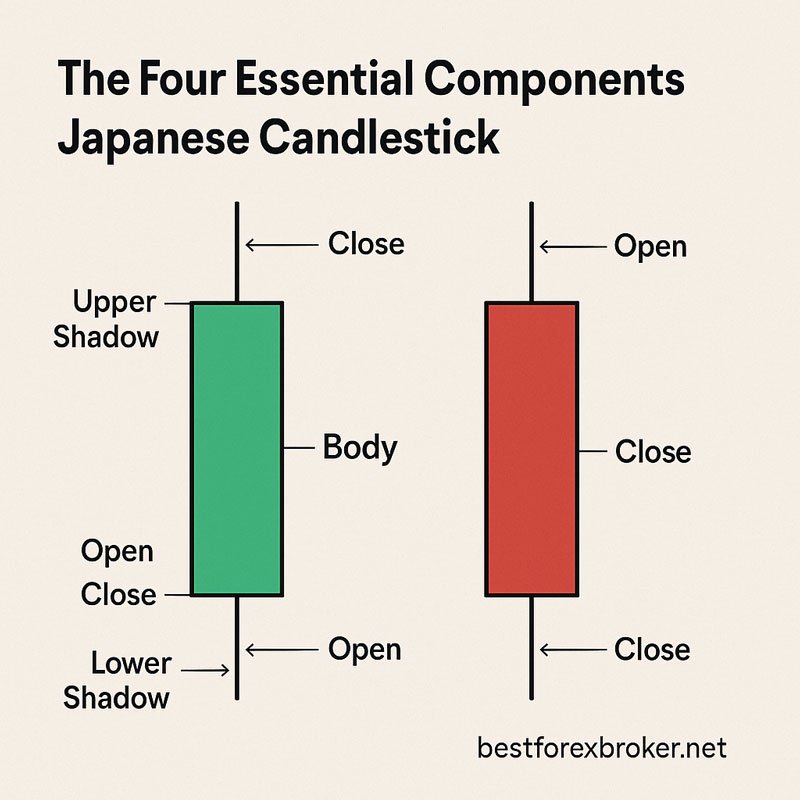
Every Japanese candlestick consists of four main elements:
The Real Body: This rectangular section represents the difference between the opening and closing prices. A filled (or colored) body typically indicates the closing price was lower than the opening price, while a hollow (or differently colored) body shows the closing price was higher than the opening price.
Upper Shadow (Upper Wick): The thin line extending above the real body shows the highest price reached during that time period. Pay close attention to the length of shadows, as they reveal important information about market rejection levels.
Lower Shadow (Lower Wick): The thin line below the real body indicates the lowest price reached during the session.
Opening and Closing Prices: These determine the size and color of the real body, providing immediate insight into whether buyers or sellers controlled the session.
Bullish vs Bearish Candlesticks
Understanding the difference between bullish and bearish candlesticks is fundamental to Japanese candlestick analysis:
- Bullish Candlesticks: Usually displayed in green or white, these form when the closing price is higher than the opening price, indicating buying pressure
- Bearish Candlesticks: Typically shown in red or black, these occur when the closing price is lower than the opening price, suggesting selling pressure
Remember: The color coding may vary between trading platforms, but the principle remains the same.
Essential Single Candlestick Patterns Every Forex Trader Should Know
Single candlestick patterns can provide immediate insights into market sentiment and potential price reversals. Here are the most important formations for forex beginners:
Reversal Patterns
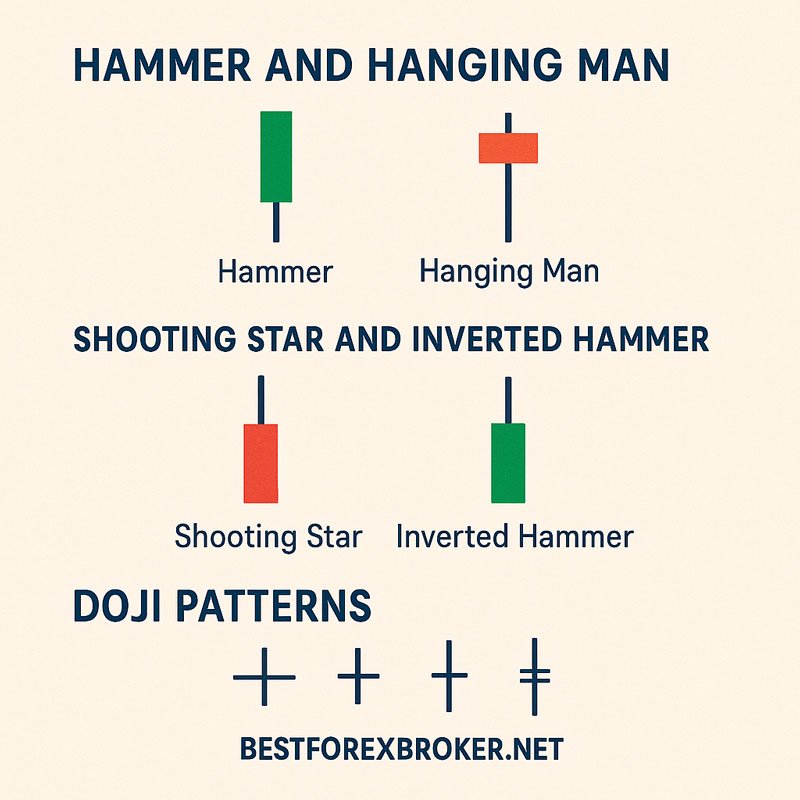
Hammer and Hanging Man: These patterns feature small real bodies with long lower shadows, indicating potential reversals. The key difference lies in their location within the trend – hammers appear after downtrends (bullish reversal), while hanging man patterns occur after uptrends (bearish reversal).
Shooting Star and Inverted Hammer: Characterized by small real bodies with long upper shadows, these patterns suggest rejection at higher price levels. Always wait for confirmation from the following candlestick before making trading decisions.
Doji Patterns: When opening and closing prices are nearly identical, a doji forms. These patterns indicate market indecision and potential trend changes. The four main types include:
- Standard Doji: Equal upper and lower shadows
- Long-legged Doji: Extended shadows showing significant volatility
- Dragonfly Doji: Long lower shadow with minimal upper shadow
- Gravestone Doji: Long upper shadow with minimal lower shadow
Continuation Patterns
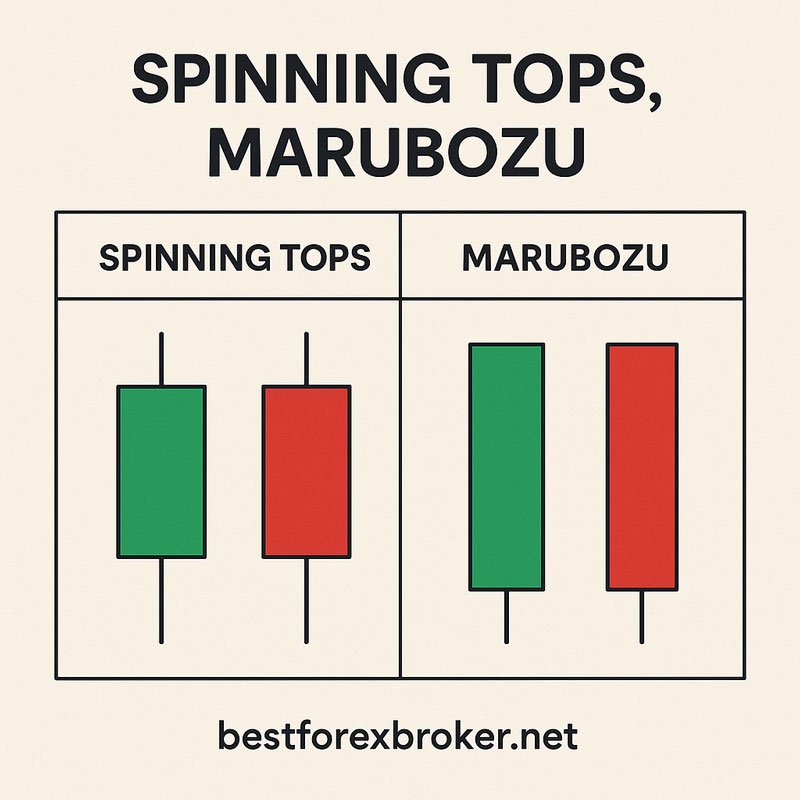
Spinning Tops: Small real bodies with relatively long shadows suggest market uncertainty but often lead to trend continuation when appearing within established trends.
Marubozu: These candlesticks have large real bodies with little to no shadows, indicating strong conviction from either buyers (bullish marubozu) or sellers (bearish marubozu).
Powerful Multi-Candlestick Patterns for Forex Success
While single candlestick patterns provide valuable insights, multi-candlestick formations often offer more reliable trading signals due to their comprehensive market story.
Two-Candlestick Patterns
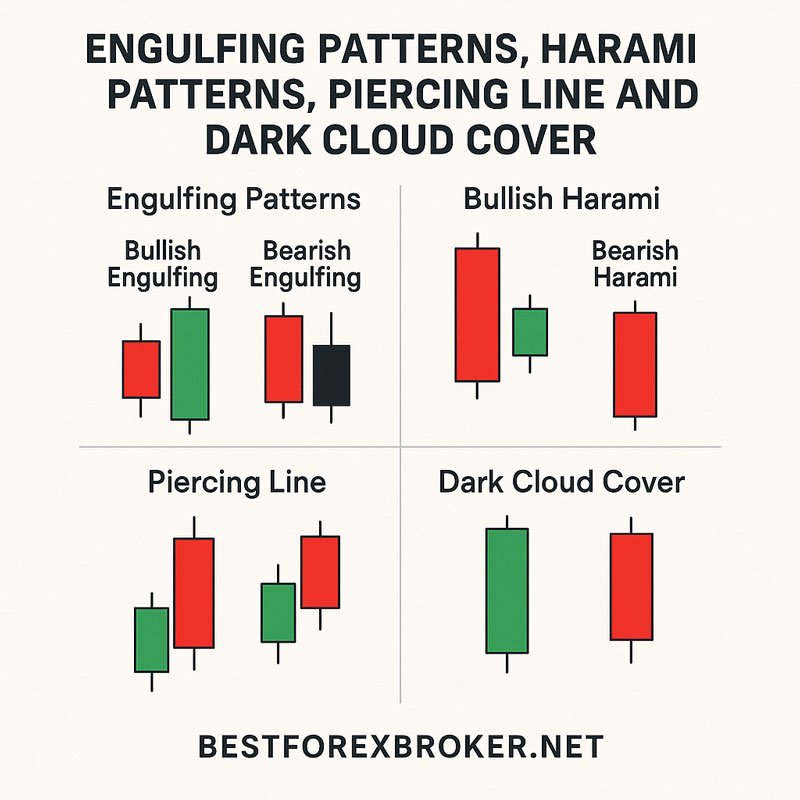
Engulfing Patterns: These occur when a second candlestick completely engulfs the previous one’s real body. Bullish engulfing patterns suggest upward momentum, while bearish engulfing patterns indicate potential downward movement. Look for engulfing patterns at key support and resistance levels for higher probability trades.
Harami Patterns: The opposite of engulfing patterns, harami formations feature a smaller second candlestick contained within the first one’s real body. These patterns often signal trend reversals or consolidation periods.
Piercing Line and Dark Cloud Cover: These patterns involve two candlesticks where the second one opens beyond the previous day’s range but closes within the first candlestick’s real body, suggesting potential reversals.
Three-Candlestick Patterns
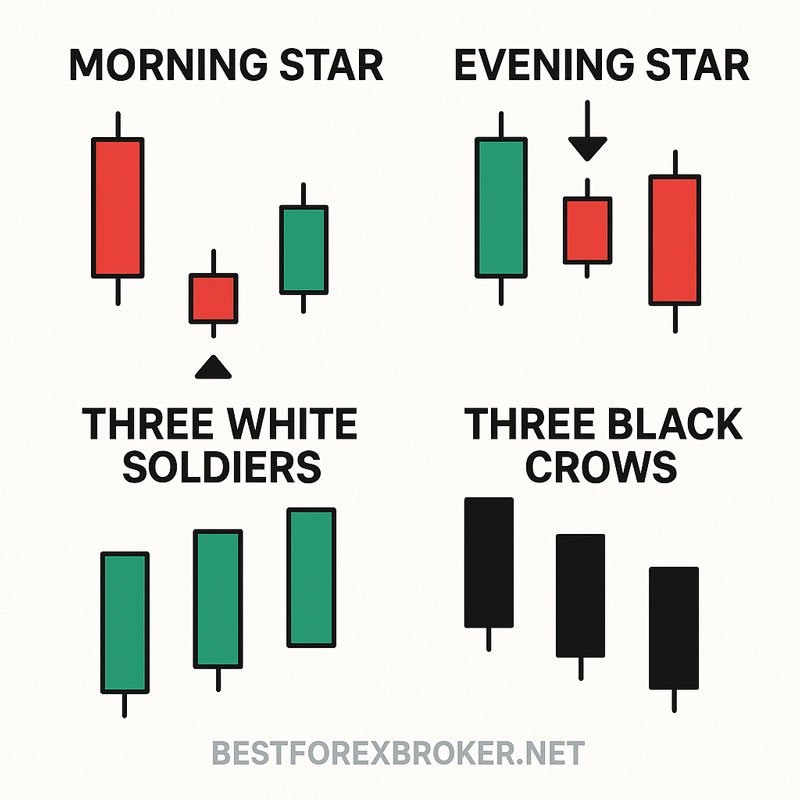
Morning Star and Evening Star: These powerful reversal patterns consist of three candlesticks and are among the most reliable formations in Japanese candlestick analysis. Morning stars indicate bullish reversals, while evening stars suggest bearish reversals.
Three White Soldiers and Three Black Crows: These continuation patterns feature three consecutive candlesticks in the same direction, indicating strong trend momentum.
Reading Japanese Candlesticks in Forex Market Context
Successful Japanese candlestick trading requires understanding patterns within broader market context. Here’s how to analyze candlesticks effectively:
Timeframe Considerations
Different timeframes provide varying perspectives on market movements:
- Daily charts: Ideal for swing trading and longer-term analysis
- 4-hour charts: Perfect for intermediate-term trading strategies
- 1-hour charts: Suitable for day trading and short-term positions
Important: Higher timeframes generally provide more reliable signals than lower timeframes.
Volume and Market Structure
While forex doesn’t have traditional volume data like stocks, understanding market structure remains crucial. Look for candlestick patterns at:
- Previous support and resistance levels
- Fibonacci retracement levels
- Major psychological price levels (round numbers)
- Trend lines and moving averages
Confirmation Techniques
Never trade based solely on a single Japanese candlestick pattern. Always seek confirmation through:
- Following candlestick behavior
- Technical indicators alignment
- Overall market trend direction
- Fundamental analysis considerations
Practical Trading Strategies Using Japanese Candlesticks
Implementing Japanese candlestick patterns in your forex trading strategy requires systematic approach and proper risk management.
Entry and Exit Strategies
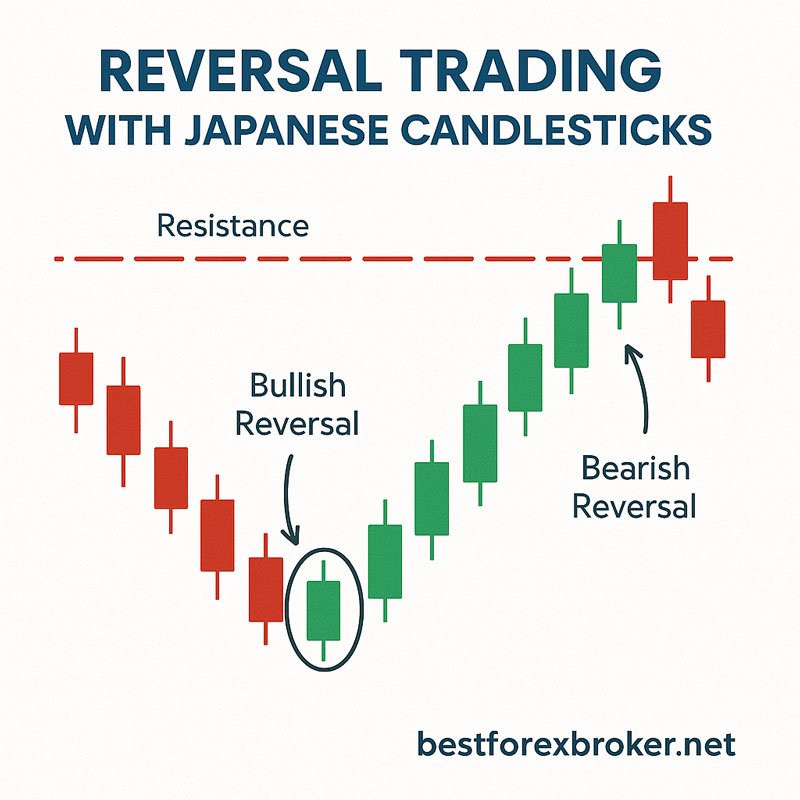
Pattern Recognition Entry: Wait for complete pattern formation before entering trades. For reversal patterns, enter when the pattern completes and shows confirmation. For continuation patterns, enter in the direction of the prevailing trend.
Stop Loss Placement: Position stop losses beyond the pattern’s extreme points. For bullish patterns, place stops below the pattern’s lowest point; for bearish patterns, place stops above the pattern’s highest point.
Profit Taking: Use multiple profit targets based on:
- Previous support/resistance levels
- Fibonacci extensions
- Risk-reward ratios of at least 1:2
Risk Management Best Practices
Position Sizing: Never risk more than 1-2% of your trading account on any single trade, regardless of how confident you feel about a Japanese candlestick pattern.
Trade Selection: Focus on patterns that align with the overall market trend for higher probability trades.
Emotional Control: Stick to your trading plan and avoid the temptation to overtrade based on every candlestick pattern you identify.
Advanced Japanese Candlestick Analysis Techniques
As you develop proficiency in basic Japanese candlestick analysis, consider incorporating these advanced concepts:
Multiple Timeframe Analysis
Analyze candlestick patterns across different timeframes to gain comprehensive market perspective. A bullish pattern on the 1-hour chart carries more weight when aligned with the daily chart’s trend direction.
Integration with Technical Indicators
Combine candlestick analysis with complementary indicators:
- Moving Averages: Confirm trend direction and dynamic support/resistance
- RSI: Identify overbought/oversold conditions alongside reversal patterns
- MACD: Validate momentum shifts suggested by candlestick formations
Pattern Quality Assessment
Not all Japanese candlestick patterns are created equal. High-quality patterns typically feature:
- Clear, well-defined formations
- Occurrence at significant price levels
- Alignment with overall market trend
- Confirmation from volume or momentum indicators
Tools and Resources for Japanese Candlestick Analysis
Recommended Trading Platforms
Most modern forex trading platforms provide excellent candlestick charting capabilities:
- MetaTrader 4/5: Industry-standard platforms with comprehensive candlestick analysis tools
- TradingView: Advanced charting platform with superior pattern recognition features
- cTrader: Professional-grade platform with intuitive candlestick visualization
Educational Resources
Continue your Japanese candlestick education through:
- Classic books like “Japanese Candlestick Charting Techniques” by Steve Nison
- Online courses and webinars from reputable trading educators
- Practice accounts for risk-free pattern recognition training
Common Mistakes to Avoid in Japanese Candlestick Trading
Overreliance on Patterns: Remember that candlestick patterns are just one tool in your trading arsenal. Always consider broader market context and fundamental factors.
Ignoring Market Trends: Trading against strong trends based solely on reversal patterns often leads to losses. The trend is your friend until it bends.
Lack of Patience: Wait for complete pattern formation and confirmation before entering trades. Premature entries significantly reduce success rates.
Poor Risk Management: Never abandon proper position sizing and stop loss placement, regardless of pattern confidence levels.
Mastering Japanese Candlestick Analysis for Forex Success
Japanese candlestick analysis represents a time-tested and highly effective approach to understanding forex market dynamics. By mastering the patterns and principles outlined in this guide, you’ll develop the ability to read market sentiment, identify high-probability trading opportunities, and make more informed trading decisions.
Remember that successful trading requires patience, discipline, and continuous learning. Start by practicing pattern recognition on demo accounts, focus on quality setups rather than quantity, and always maintain proper risk management protocols.
The journey to becoming proficient in Japanese candlestick analysis takes time, but the investment in learning these skills will serve you throughout your forex trading career. As you gain experience, you’ll develop an intuitive understanding of how these ancient patterns reflect modern market psychology, giving you a significant edge in the competitive world of forex trading.
Continue studying, practicing, and refining your approach, and remember that even the most experienced traders are constantly learning and adapting their strategies to changing market conditions.
Frequently Asked Questions (FAQ)
How reliable are Japanese candlestick patterns in forex trading?
Japanese candlestick patterns are highly reliable when used correctly with proper confirmation and risk management. However, no pattern guarantees success, and they work best when combined with other forms of technical and fundamental analysis.
Which timeframe is best for trading Japanese candlestick patterns?
The optimal timeframe depends on your trading style. Day traders often use 1-hour to 4-hour charts, while swing traders prefer daily charts. Higher timeframes generally provide more reliable signals.
Can I trade every Japanese candlestick pattern I see?
No, you should be selective and only trade high-quality patterns that align with your overall market analysis. Quality over quantity is crucial for long-term success.
How long does it take to master Japanese candlestick analysis?
Basic pattern recognition can be learned within weeks, but mastering the art of reading market psychology through candlesticks takes months of practice and real trading experience.
Do Japanese candlestick patterns work in all currency pairs?
Yes, candlestick patterns work across all forex currency pairs, though major pairs tend to provide cleaner and more reliable patterns due to higher liquidity.
Should I use Japanese candlesticks alone or combine them with other indicators?
While Japanese candlesticks are powerful standalone tools, combining them with complementary technical indicators and fundamental analysis significantly improves trading success rates.
