The Bollinger Bands strategy represents one of the most powerful and versatile technical analysis tools in forex trading. Created by renowned trader John Bollinger in the 1980s, this indicator has stood the test of time and remains a cornerstone of successful trading strategies worldwide.
What makes Bollinger Bands so special? Unlike static support and resistance levels, Bollinger Bands dynamically adapt to market volatility, providing traders with real-time insights into price behavior and potential trading opportunities.
For forex basic beginners, understanding the Bollinger Bands strategy is crucial because it combines multiple trading concepts into one comprehensive tool. Whether you’re looking to identify trending markets, range-bound conditions, or potential breakout scenarios, Bollinger Bands offer the flexibility and reliability that modern traders demand.
Key Takeaway: The Bollinger Bands strategy isn’t just about following lines on a chart – it’s about understanding market psychology and volatility patterns that drive currency movements.
Understanding Bollinger Bands Components
The Three Essential Components
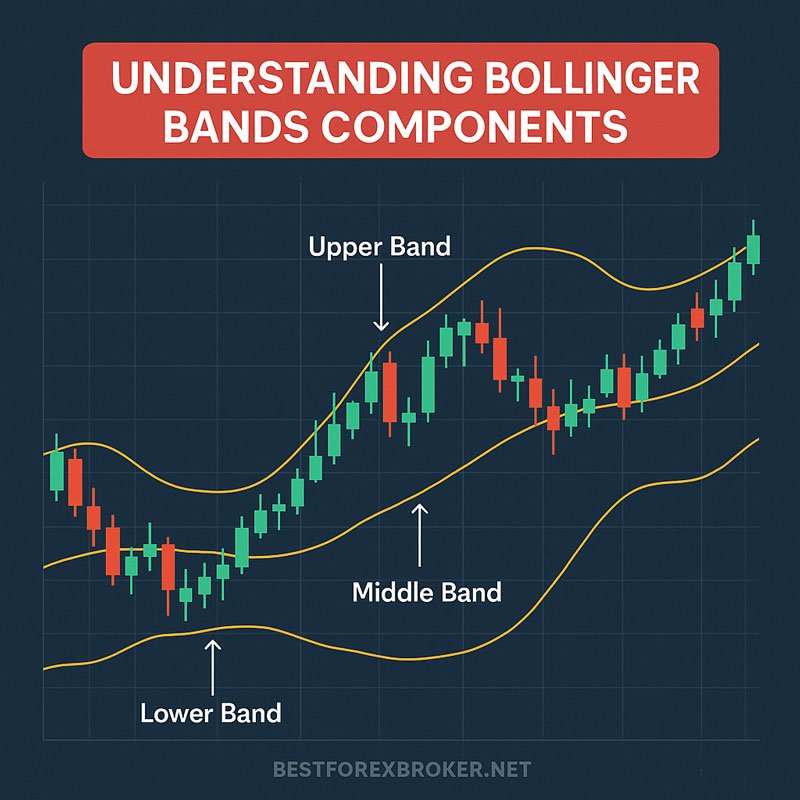
Bollinger Bands consist of three distinct lines that work together to create a dynamic trading envelope around price action:
1. The Middle Band (Simple Moving Average)
- Default setting: 20-period Simple Moving Average (SMA)
- Purpose: Represents the average price over the specified period
- Significance: Acts as dynamic support/resistance and trend direction indicator
2. The Upper Band
- Calculation: Middle Band + (2 × Standard Deviation)
- Function: Dynamic resistance level that expands during high volatility
- Trading signal: Price touching or exceeding this level often indicates overbought conditions
3. The Lower Band
- Calculation: Middle Band – (2 × Standard Deviation)
- Function: Dynamic support level that contracts during low volatility
- Trading signal: Price touching or falling below often indicates oversold conditions
Visual Understanding of Band Behavior
The magic of Bollinger Bands lies in their dynamic nature. During periods of high volatility, the bands expand to accommodate larger price swings. Conversely, during calm market conditions, the bands contract, creating what traders call a “squeeze.”
Important Note: The standard deviation multiplier of 2 captures approximately 95% of price action within the bands, making breakouts statistically significant events.
Key Bollinger Bands Concepts Every Trader Must Know
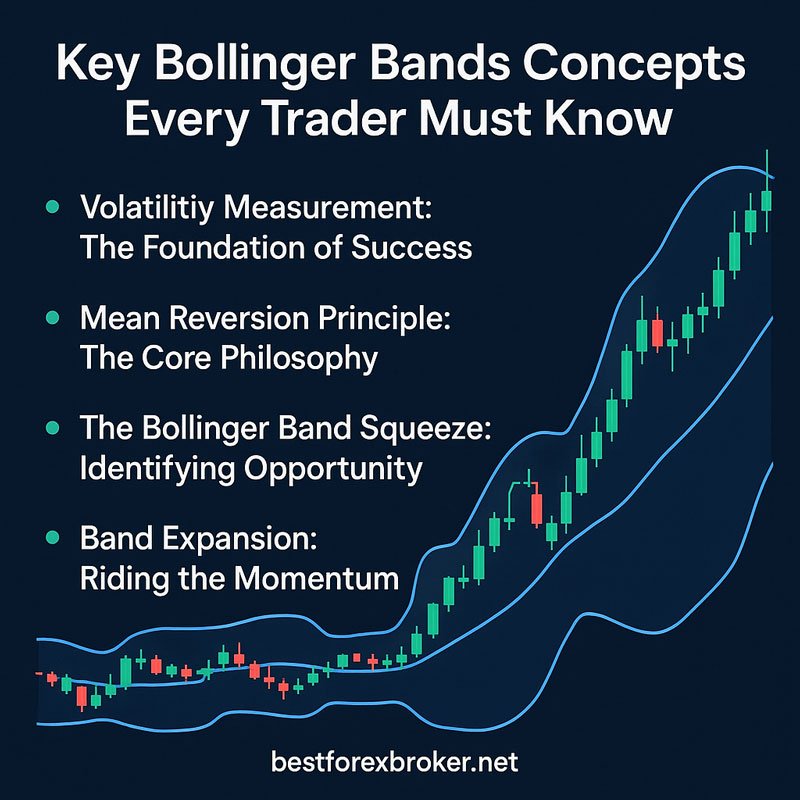
Volatility Measurement: The Foundation of Success
Understanding volatility is crucial for implementing any Bollinger Bands strategy effectively. The width of the bands directly correlates with market volatility:
- Wide bands = High volatility = Greater profit potential but higher risk
- Narrow bands = Low volatility = Limited profit potential but lower risk
Mean Reversion Principle: The Core Philosophy
The Bollinger Bands strategy is built on the statistical principle of mean reversion. This concept suggests that prices tend to return to their average value over time, making extreme deviations from the middle band (SMA) temporary conditions.
Why does mean reversion work in forex?
- Currency markets are influenced by economic fundamentals
- Extreme price movements often correct themselves
- Central bank interventions often push currencies back toward fair value
The Bollinger Band Squeeze: Identifying Opportunity
The squeeze is perhaps the most powerful setup in the Bollinger Bands strategy. It occurs when:
- Bands contract to unusually narrow levels
- Volatility drops to extremely low levels
- Price consolidates within a tight range
Critical Point: The squeeze often precedes significant price movements, making it an excellent predictor of future volatility expansion.
Band Expansion: Riding the Momentum
When bands expand rapidly, it signals explosive price movement. Smart traders learn to:
- Identify the direction of expansion early
- Position themselves to benefit from momentum
- Manage risk as volatility increases
Read me: Top Forex Trading Systems – Boost Your Strategy
Core Bollinger Bands Trading Strategies
Strategy #1: The Bollinger Band Bounce
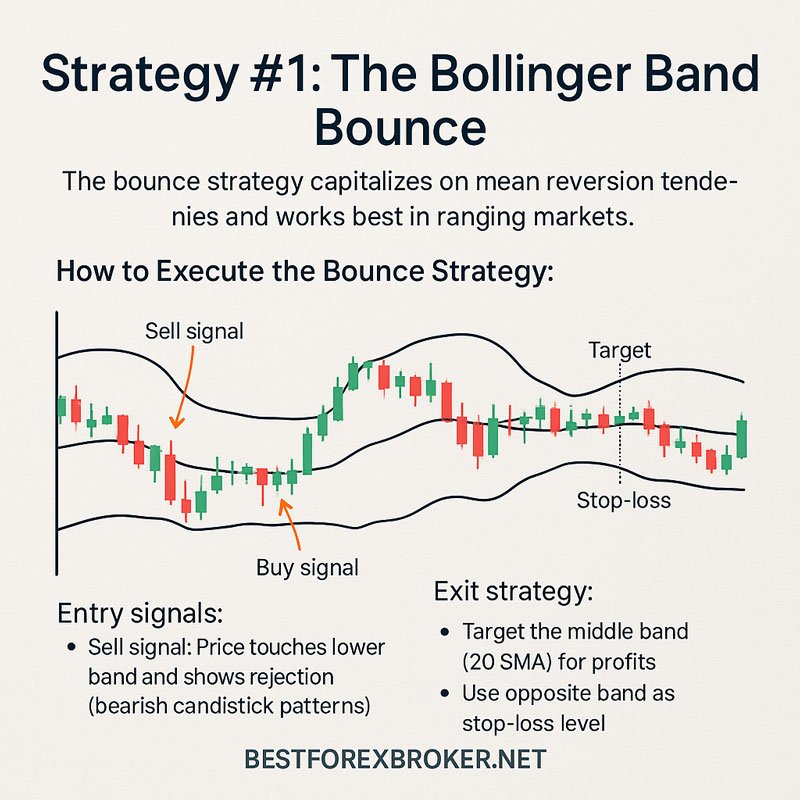
The bounce strategy capitalizes on mean reversion tendencies and works best in ranging markets.
How to Execute the Bounce Strategy:
- Identify the setup:
- Price approaches upper or lower band
- No strong trending momentum present
- Volume remains relatively normal
- Entry signals:
- Sell signal: Price touches upper band and shows rejection (bearish candlestick patterns)
- Buy signal: Price touches lower band and shows support (bullish candlestick patterns)
- Exit strategy:
- Target the middle band (20 SMA) for profits
- Use opposite band as stop-loss level
Best Market Conditions for Bounce Strategy:
- Sideways trending markets
- Low to moderate volatility environments
- Currency pairs with strong fundamental ranges
Pro Tip: The bounce strategy works exceptionally well during Asian trading sessions when volatility is typically lower.
Strategy #2: The Bollinger Band Squeeze
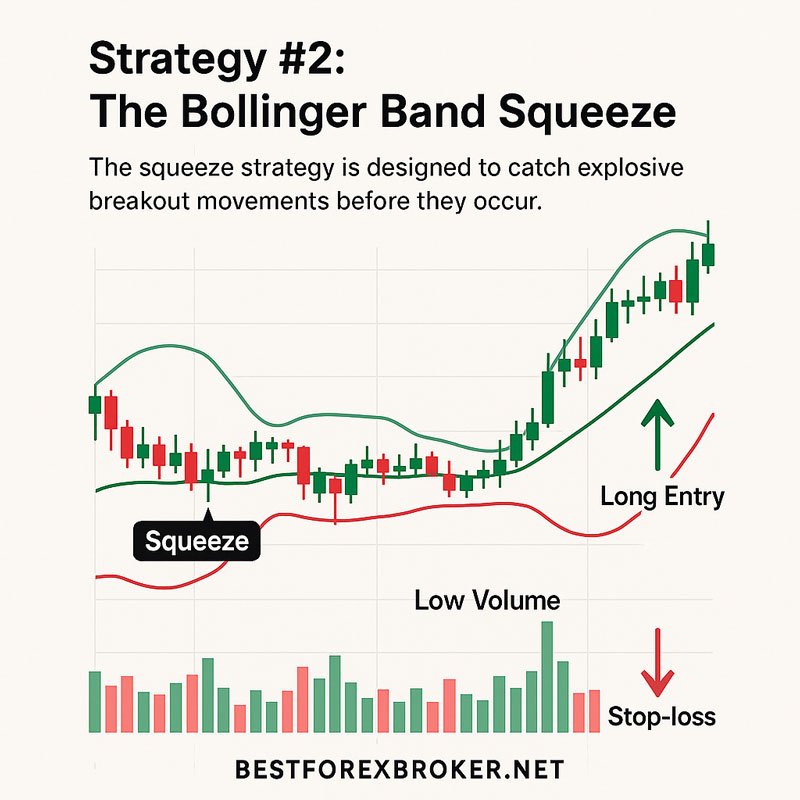
The squeeze strategy is designed to catch explosive breakout movements before they occur.
Identifying a Proper Squeeze:
- Visual confirmation:
- Bands narrow significantly compared to recent periods
- Price consolidates within a tight range
- Volume often decreases during the squeeze
- Preparation phase:
- Set alerts for breakout above upper band or below lower band
- Prepare position sizing for increased volatility
- Identify key support/resistance levels outside the squeeze zone
- Execution:
- Long position: Enter when price breaks above upper band with volume
- Short position: Enter when price breaks below lower band with volume
- Use initial stop-loss at the opposite band
Risk Management During Squeeze Breakouts:
- Position size smaller due to increased volatility potential
- Wider stop-losses to accommodate natural volatility expansion
- Quick profit-taking as momentum can reverse rapidly
Strategy #3: The Bollinger Band Breakout
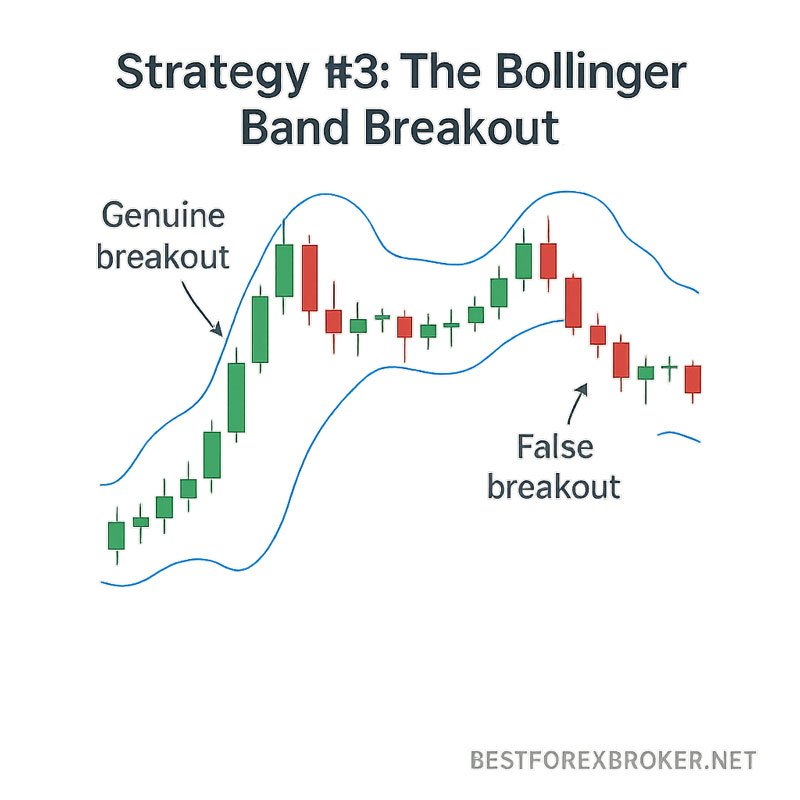
The breakout strategy focuses on continuation patterns when price moves beyond the bands.
Genuine vs. False Breakouts:
Characteristics of genuine breakouts:
- Accompanied by increased volume
- Sustained movement beyond the band (not just a spike)
- Fundamental news or events supporting the direction
- Multiple timeframe confirmation
Warning signs of false breakouts:
- Low volume during the breakout
- Immediate reversal back inside the bands
- Occurs during low liquidity periods
- Lacks fundamental support
Advanced Breakout Techniques:
- The 2% Rule: Only consider breakouts that extend at least 2% beyond the band
- Volume Confirmation: Require 150% of average volume during breakout
- Time-based Filtering: Avoid breakouts during news releases or market opens
Warning: False breakouts are common in forex markets. Always wait for confirmation before committing significant capital.
Advanced Bollinger Bands Techniques
Double Bollinger Bands: Multi-Timeframe Analysis
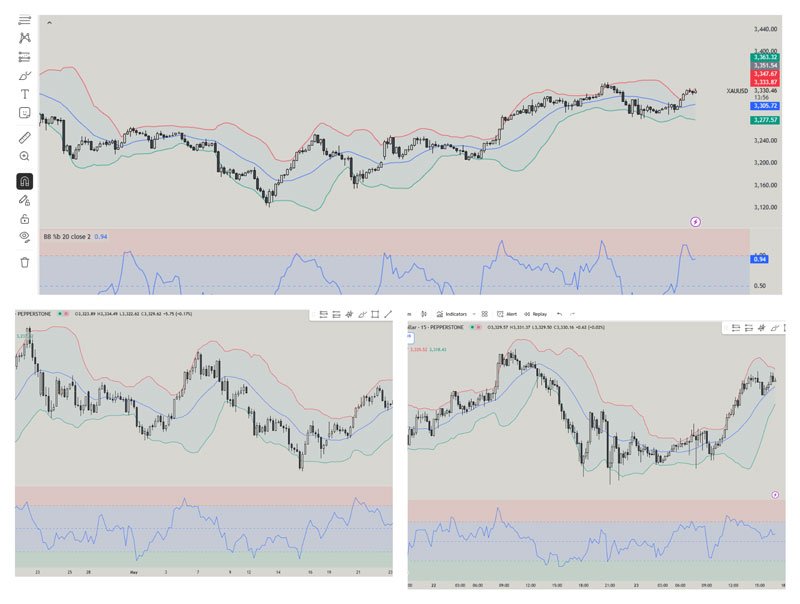
Using multiple timeframes provides superior context for trading decisions:
- Primary timeframe: 4-hour or daily charts for overall trend
- Secondary timeframe: 1-hour charts for precise entry and exit
- Tertiary timeframe: 15-minute charts for fine-tuning
Implementation Strategy:
- Identify trend direction on higher timeframe
- Wait for squeeze or setup on intermediate timeframe
- Use lower timeframe for precise entry timing
Bollinger Band %B Indicator: Precise Positioning
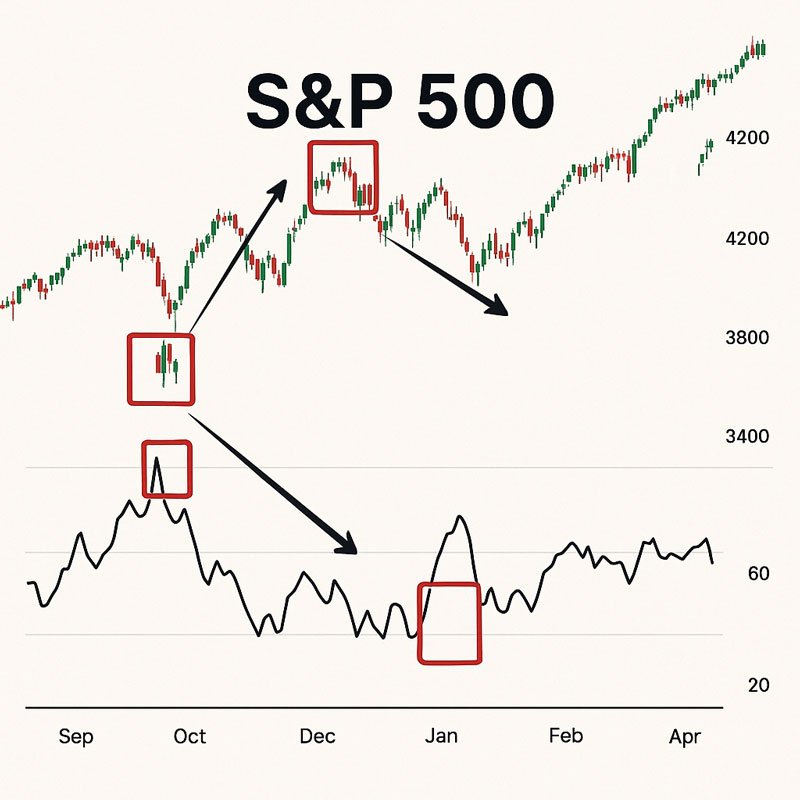
The %B indicator quantifies where price sits relative to the bands:
- %B = 1.0: Price at upper band
- %B = 0.5: Price at middle band (20 SMA)
- %B = 0.0: Price at lower band
Trading Applications:
- %B > 0.8: Consider selling opportunities
- %B < 0.2: Consider buying opportunities
- %B crossing 0.5: Potential trend change signals
Bollinger Band Width: Volatility Measurement
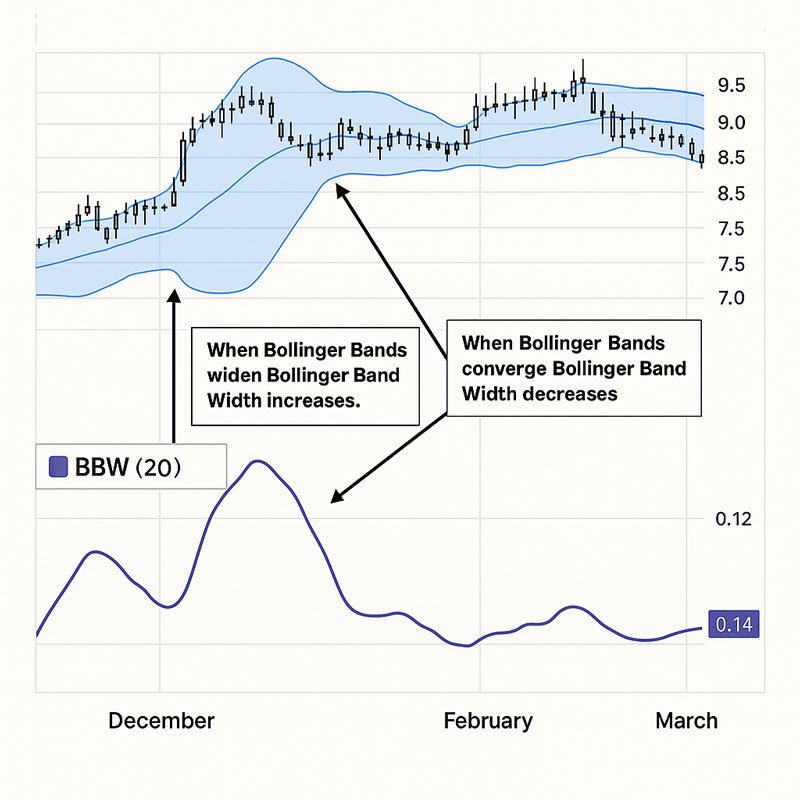
Band Width measures the distance between upper and lower bands:
- High readings: Expect volatility to decrease
- Low readings: Prepare for volatility expansion
- Extreme readings: Often mark significant turning points
Risk Management and Best Practices
Position Sizing with Bollinger Bands
Proper position sizing is crucial for long-term success:
Volatility-Based Position Sizing:
- Low volatility (squeeze): Smaller initial positions, prepared to add
- High volatility (expansion): Larger positions but with tighter risk management
- Normal volatility: Standard position sizing according to account rules
Stop-Loss Placement Strategies
Effective stop-loss placement protects capital while allowing strategies to work:
Strategy-Specific Stop-Loss Guidelines:
- Bounce Strategy:
- Place stops just beyond the opposite band
- Consider using ATR-based stops for better accuracy
- Squeeze Strategy:
- Initial stops at the middle band
- Trail stops as momentum develops
- Breakout Strategy:
- Stops just inside the breakout band
- Use volatility stops based on recent price action
When to Avoid Bollinger Bands Trades
Not all market conditions favor Bollinger Bands strategies:
Avoid Trading During:
- Major news releases (unless specifically trading the news)
- Extremely low liquidity periods (major holidays)
- Strong trending markets without pullbacks (for bounce strategies)
- Highly correlated currency events affecting multiple pairs simultaneously
Critical Reminder: The best traders know when NOT to trade. Patience often generates more profits than overtrading.
Common Mistakes and How to Avoid Them
Mistake #1: Ignoring Market Context
Solution: Always consider broader market trends and fundamental factors
Mistake #2: Using Default Settings Blindly
Solution: Optimize Bollinger Band parameters for specific currency pairs and timeframes
Mistake #3: Overrelying on Single Signals
Solution: Combine Bollinger Bands with complementary indicators like RSI or MACD
Mistake #4: Poor Risk Management
Solution: Never risk more than 2% of account balance on any single trade
Bollinger Bands in Different Market Environments
Bull Markets vs. Bear Markets
In bull markets:
- Upper band breakouts more reliable
- Lower band bounces offer better risk/reward
- Trend-following strategies work better
In bear markets:
- Lower band breakouts more common
- Upper band rejections more reliable
- Mean reversion strategies often more profitable
Trending vs. Sideways Markets
Trending markets:
- Price often rides one band (walking the bands)
- Breakout strategies more effective
- Squeeze setups less common but more powerful
Sideways markets:
- Bounce strategies excel
- Mean reversion principles dominate
- Multiple opportunities for range trading
Tools and Platforms for Bollinger Bands Trading
Recommended Trading Platforms
- MetaTrader 4/5: Industry standard with excellent Bollinger Bands implementation
- TradingView: Superior charting and analysis capabilities
- cTrader: Advanced order management and risk tools
Essential Settings and Customizations
Standard Settings:
- Period: 20
- Standard Deviation: 2
- Applied to: Close prices
Alternative Settings for Different Strategies:
- Scalping: Period 10, StdDev 1.5
- Swing Trading: Period 50, StdDev 2.5
- Position Trading: Period 100, StdDev 3.0
Mobile Trading Considerations
Key features for mobile Bollinger Bands trading:
- Clear band visualization on small screens
- Easy alert setup for squeeze and breakout conditions
- Quick order entry and modification capabilities
Conclusion
The Bollinger Bands strategy remains one of the most effective and versatile tools in forex trading. Its ability to adapt to changing market conditions while providing clear visual signals makes it invaluable for both beginners and experienced traders.
Key success factors for Bollinger Bands trading:
- Understand the underlying principles of mean reversion and volatility
- Master the three core strategies: bounce, squeeze, and breakout
- Implement proper risk management techniques
- Practice patience and discipline in execution
- Continuously learn from both successful and unsuccessful trades
Remember that no strategy works 100% of the time. The goal is to find consistent edges in the market and manage risk effectively. Bollinger Bands provide that edge when used correctly and combined with proper market analysis.
Start your journey by paper trading these strategies, backtesting on historical data, and gradually implementing them with small position sizes. As your confidence and skills develop, you can increase your involvement and potentially achieve consistent profitability in the forex markets.
The foreign exchange market offers tremendous opportunities for those who approach it with knowledge, preparation, and respect. The Bollinger Bands strategy can be your guide to navigating these opportunities successfully.
Frequently Asked Questions (FAQ)
What are the best currency pairs for Bollinger Bands strategy?
Major pairs like EUR/USD, GBP/USD, and USD/JPY work best due to their liquidity and predictable behavior. These pairs respond well to technical analysis and have sufficient volatility for profitable trades.
How do I know when a Bollinger Band squeeze is about to end?
Look for these signs: increasing volume, price testing the bands more frequently, narrowing to historical extremes, and fundamental catalysts approaching. The combination of these factors often precedes breakouts.
Can I use Bollinger Bands for scalping?
Yes, but adjust the settings (try 10-period, 1.5 standard deviation) and use shorter timeframes (1-5 minutes). Focus on bounce strategies during low volatility periods for best results.
What’s the difference between Bollinger Bands and moving average envelopes?
Bollinger Bands adapt to volatility using standard deviation, while moving average envelopes use fixed percentages. This makes Bollinger Bands more responsive to changing market conditions.
Should I use Bollinger Bands alone or combine with other indicators?
Combine with complementary indicators like RSI for overbought/oversold confirmation, MACD for momentum, and volume indicators for breakout confirmation. This increases success rates significantly.
How often should I adjust Bollinger Bands settings?
Start with standard settings (20, 2) and only adjust if you have specific backtested reasons. Different currency pairs and timeframes may benefit from optimization, but avoid over-optimization.
What’s the best time frame for Bollinger Bands strategy?
For beginners, start with 4-hour and daily charts. These timeframes provide cleaner signals and require less screen time. Advanced traders can use multiple timeframes simultaneously.
How do I handle false breakouts with Bollinger Bands?
Use volume confirmation, wait for candle closes beyond bands, implement proper stop-losses, and avoid trading during low liquidity periods. False breakouts are part of trading – manage them, don’t try to eliminate them.
